ALL BLOG CONTENT IS FOR INFORMATIONAL PURPOSES ONLY. ANY REFERENCE TO OR MENTION OF INDIVIDUAL STOCKS, INDEXES, OR OTHER SECURITIES ARE NOT RECOMMENDATIONS AND ARE SPECIFICALLY NOT REFERENCED AS PAST RECOMMENDATIONS OF PATTON WEALTH ADVISORS. ALL GRAPHS, CHARTS, AND TABLES ARE PROVIDED FOR ILLUSTRATION PURPOSES ONLY. EXPRESSIONS OF OPINION ARE ALSO NOT RECOMMENDATIONS AND ARE SUBJECT TO CHANGE WITHOUT NOTICE IN REACTION TO SHIFTING MARKET, ECONOMIC, OR POLITICAL CONDITIONS. IT IS COMMON FOR US TO USE A FUND AS A PROXY FOR AN INDEX OR ASSET CLASS. FOR MORE DETAILS SEE OUR FULL DISCLOSURE HERE.
Market Commentary for the week ending December 31st, 2020
Summary
The major market averages all closed the year at record highs.
Multiple all-time records made 2020 a year like no other.
The housing market was started strong and gained momentum throughout the year.
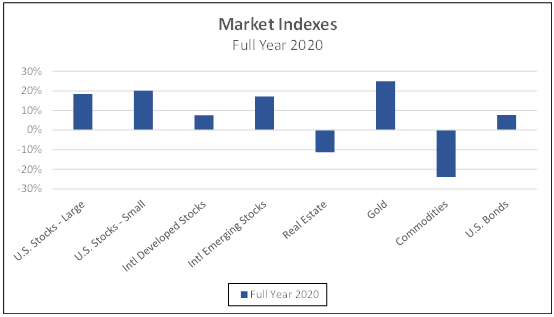
Full Year 2020 Performance Summary
As more time passes, more records are broke and 2020 was no different. Below I highlight three historic all-time records achieved in 2020.
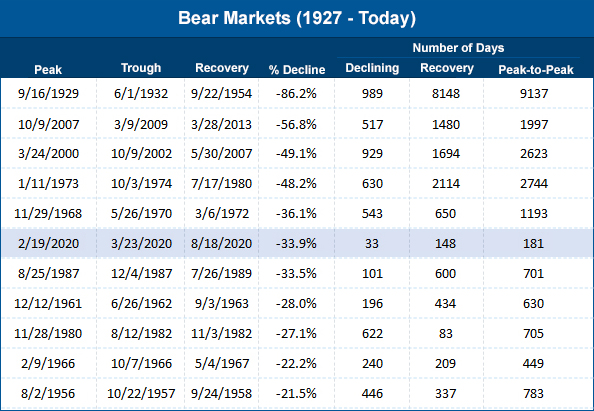
2020 All-Time Record #1: Shortest bear market and recovery in history
The market rallied early in the year hitting a high on February 19th before collapsing on concerns of COVID-19. In just 33 calendar days the S&P 500 collapsed -33.9%. The MAGNITUDE of this drop was certainly not historic but the SPEED at which it reached this bottom has been unmatched in modern times. Then, within a short 148 additional calendar days, it had fully recovered reaching new highs. This rapid pace of recovery was the second fastest in history.
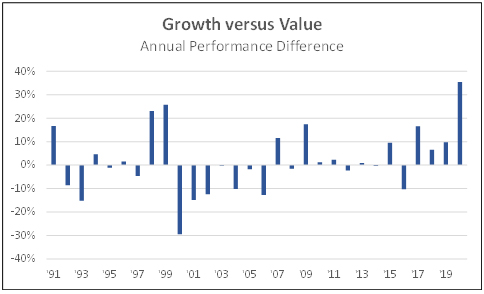
2020 All-Time Record #2: Growth beat Value by the widest margin ever
Growth stocks, those generally with faster sales and earnings growth including most technology stocks, outperformed more conservative value stocks by +35.4% for the year. This was the widest margin in 30 years as illustrated in the accompanying graph with 2020 being the 5th of the last 6 years growth has outperformed.
Many investors today believe that growth stocks will continue to dominate the market and they may. It is worth noting though that cumulatively from 1990 – 2019 value outperformed growth and, furthermore, value has gone through its dominant cycles such as 2000 – 2006 when it outperformed for 7 consecutive years.
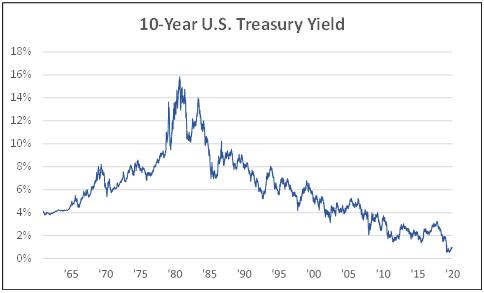
2020 All-Time Record #3: 10-Year U.S. Treasury Yield hits record low
Yields on U.S. Treasuries have been trending downward for 4 decades after peaking above 16% in 1981. Just as many thought they could go no lower, in August the yield dropped to a new record low of 0.508%. Although this is a record in the U.S., many countries today including Switzerland, Denmark, and Japan have negative rates. It is widely expected that rates will remain low given the guidance from our Federal Reserve in recent months.
These historic low interest rates are extremely important for investors as low interest rates make stocks more attractive. If and when rates do move higher once again, this could put some downward pressure on stock prices.
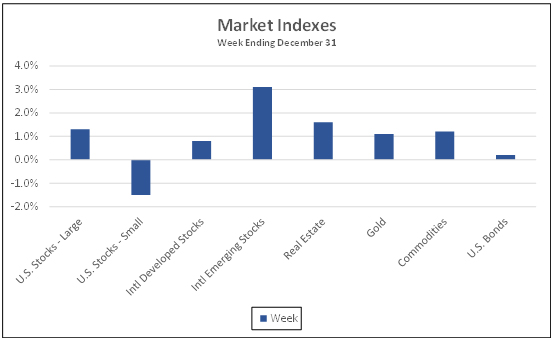
Large U.S. stocks posted gains in the final week of trading, up another +1.3% as measured by the S&P 500, in what was a very strong year. The S&P 500, Dow Jones Industrials, and NASDAQ Composite will all start 2021 at record levels.
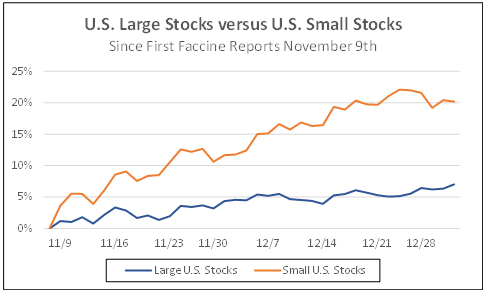
Small U.S. stocks outperformed large for the year gaining +20.0% even after slipping -1.5% in the final week. This outperformance came in the final two months of the year, as the accompanying graph shows, following the first vaccine reports on November 9th and investors’ renewed appetite for more risk.
Every sector except energy was higher for the week with the best performing being utilities gaining +2.4%. Although strong for the week, utilities were among the biggest laggards for the year.
International stocks were overall higher for the week but with mixed results. Among developed markets, Japanese stocks were the biggest winners up +2.6% while Eurozone stocks were down fractionally impacted by loses in Spain, the U.K., and Germany.
Emerging markets closed the year very strong up +3.1% for the week fueled by a strong rally in Chinese stocks after a relatively sizeable decline the week before.
Gold was among the very best performers in 2020 gaining another +1.1% in the final week of trading to close the year up +24.8%. The other alternative assets were also higher for the week with commodities gaining +1.2% and real estate stocks climbed +1.6% although both were lower for the year.
Bond prices inched higher for the week by +0.2% as yields slipped. The benchmark U.S. 10-Year Treasury yield closed the year at 0.919%. Although this is near record lows it is meaningfully above the 0.508% hit in early August as previously discussed.
The overall performance of the markets in 2020 was by no means historic but it was certainly a strong year benefitting many investors. Large U.S. stocks were higher by +18.4% as measured by the S&P 500 while the Dow Industrials lagged up just +9.7%. The real outperformer was the tech-heavy NASDAQ surging +44.9%.
Small U.S. stocks have lagged behind large for several years but edged out a win in 2020 gaining +20.0%. As I noted in the weekly performance update below, this outperformance came late in the year.
International stocks have underperformed U.S. stocks for several years now and continued to do so in 2020. Developed markets were higher by just +7.6% while emerging markets did better gaining +17.0%.
Gold could be considered a surprise winner as it is normally viewed as a safe-haven when other investments are moving lower. That was not the case in 2020 as gold surged +24.8% while most everything else rallied as well. Furthermore, gold has often performed well during period of higher inflation which has also not been the case in 2020.
Commodities and real estate stocks were both lower for the year arguably due to COVID-19 and a potentially weakening economy.
Bond prices climbed +7.7% as yields fell as discussed above.
U.S. Housing Market Update
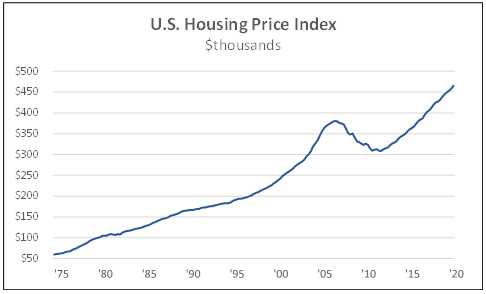
The housing market remained remarkably strong in 2020 and picked up momentum as people desire larger homes outside of cities following the pandemic. The average home price, according to the Federal Reserve, climbed to $465,840 and is up +8.4% year-over-year according to a separate report.
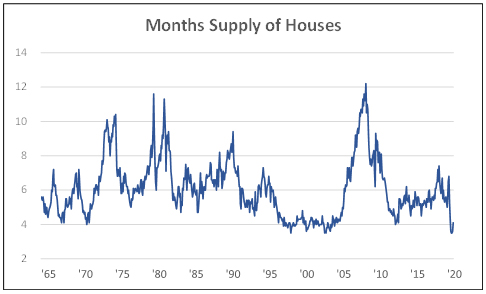
There are some concerns that housing may be in a bubble but others are arguing that’s not the case. One indicator pointed to suggesting we’re not experiencing a bubble is the months of supply on the market. As the graph below shows there is just 4 months supply of homes on the market today which is near a record low and a far cry from the peak above 12 months during the bubble more than a decade ago.
In addition to a low supply of houses on the market, low interest rates make homes more affordable, incomes are rising, and there is expected to be increasing demand from a younger generation. All of this could help keep the housing market strong.
Economic Indicators
There was very little economic data reported during the shortened holiday week.
The S&P Case-Shiller Home Price Index surged in October, the most recently month reported, by +8.4% over the same period a year ago fueled by record low interest rates and tight supplies. The biggest price gains were in Phoenix (+12.7%, Seattle (+11.7%), and San Diego (+11.6%) while New York, Chicago, and Las Vegas lagged behind with gains all in the +6% range.
The Chicago Purchasing Managers Index, a measure of business conditions in the Chicago area, increased for the first time in three months to a reading of 59.5 from 58.2 the month before. A reading above 50 indicates economic expansion. The improvement in the Chicago was contrary to readings in New York and Philadelphia leading economists to believe we are experiencing a broader slowdown.
Initial Jobless Claims declined by 19,000 from the week before to 787,000 while continuing claims via state programs dropped by 103,000 to 5.22 million. Initial claims have remained persistently high compared to the average of just over 200,000 per week pre-pandemic.
The information provided here is for general informational purposes only and should not be considered an individualized recommendation or personalized investment advice. Any specific securities or investment strategies mentioned here may not be suitable for everyone. Each investor needs to review an investment strategy for his or her own situation before making any investment decision including whether to retain an investment adviser.
All expressions of opinion are subject to change without notice in reaction to shifting market, economic or political conditions. Data contained herein from third party providers is obtained from what are considered reliable sources. However, its accuracy, completeness or reliability cannot be guaranteed. This content was created as of the specific date indicated and reflects the author’s views as of that date. Supporting documentation for any claims or statistical information is available upon request.
Past performance is no guarantee of future results. Any comments about the performance of securities, markets, or indexes and any opinions presented are not to be viewed as indicators of future performance.
Investing involves risk including loss of principal.
Indexes are unmanaged, do not incur management fees, costs and expenses, and cannot be invested in directly. For more information on specific indexes please see full disclosure here.
Any charts, tables, forecasts, etc. contained herein are for illustrative purposes only, may be based upon proprietary research, and are developed through analysis of historical public data.
All corporate names shown above are for illustrative purposes only and are NOT recommendations.
International investments involve additional risks, which include differences in financial accounting standards, currency fluctuations, geopolitical risk, foreign taxes and regulations, and the potential for illiquid markets. Investing in emerging markets may accentuate these risks.
Fixed income securities are subject to increased loss of principal during periods of rising interest rates. Fixed-income investments are subject to various other risks including changes in credit quality, market valuations, liquidity, prepayments, early redemption, corporate events, tax ramifications and other factors. Lower-rated securities are subject to greater credit risk, default risk, and liquidity risk.
IMPORTANT NOTICE: INFORMATION ABOUT PAST PERFORMANCE
Not indicative of future returns. Past performance is not indicative of future returns, which may vary. Accordingly, future returns are not guaranteed and there can be no assurance that any Patton Fund, Strategy, or Portfolio (“Patton Investments”) will achieve comparable investment results or its investment objective. You may lose money on your investment in a Patton Investment.
Strategy Developed based on Back-testing. The investment strategies used by Patton were developed, in part, by back-testing its investment program against past market and economic conditions. In other words, the strategies were designed to succeed based on knowledge of events that occurred in the past. One limitation of such a strategy is that it is inherently focused on the past, and cannot necessarily take account of market and economic conditions that may arise in the future. If future market and economic conditions are different from past market and economic conditions, and if investors behave differently from past investors, Patton’s investment strategies may not work as anticipated and the Strategy, Fund, or any Patton Investments, may lose money.
Fees and Distributions. The performance information shown reflects the deduction of actual expenses of the applicable Patton Investment for periods during which the Patton Investment has been in operation (see below). The performance figures shown reflect the reinvestment of all dividends, interest and other income, and assume that the applicable Patton Investment has not made any distributions to investors. Estimated fees and expenses including brokerage commissions, borrowing costs, and advisory fees, have been deducted from all back-tested performance.
Portfolio Characteristics. Portfolio characteristics, including specific holdings, contributors to performance, and country, sector and industry exposure, are shown as of the date indicated only, and are subject to change without notice. Portfolio characteristics are designed to illustrate the application of the Patton Investments’ investment style only, and should not be considered a recommendation.
Third Party Information. Information contained herein is based on data obtained from statistical services, company reports or communications, or other sources. Patton Fund Management believes these sources to be reliable. However, we have not verified this information, and we make no representations whatsoever as to its accuracy or completeness.
IMPORTANT NOTICE: INFORMATION ABOUT BACK-TESTED PAST PERFORMANCE
Performance results may be presented that pre-dates the commencement of operations of a Patton Investment Strategy. Because the Patton Investment Strategy was not in operation during certain periods shown, the performance information prior to the date the Patton Investment Strategy commenced operations is back-tested performance (sometimes referred to as hypothetical performance).
Patton Investment Strategies Inception Dates (first full month)
Patton 45: April 2001 (not open to new investors)
Patton Edge Strategy: February 2010
Patton Flex Strategy: February 2010
Audacity Strategy: April 2020
There are several important factors to consider when reviewing back-tested, or hypothetical, performance information:
Back-tested Performance is Hypothetical. The performance information shown for the Patton Investment Strategy you select includes performance information that is hypothetical, and is not real nor based on an actual portfolio managed by Patton. As such, the back-tested portion of the performance presentation does not represent the investment performance or the actual Patton Investment Strategy or any investors in the Patton Investment Strategy. The securities in these hypothetical portfolios were selected with the full benefit of hindsight, after their performance over the period shown was known. It is not likely that similar results could be achieved in the future. The back-tested results may not reflect the impact that any material market or economic factors might have had on the results if the Strategy had been used during the period to actually manage client assets. Furthermore, back-testing does not reflect how Patton actually might have reacted when managing client investments to economic and market events.The hypothetical portfolios presented here are purely illustrative, and representative only of a small sample of possible future scenarios.
Back-testing is Subject to Limitations. While it is believed that back-tested performance information presented is relevant to evaluating an investment in the Patton Investment Strategy, no representation is or could be made that the information presents what the performance results would have been in the past or are likely to be in the future. There are frequently sharp differences between hypothetical performance results and actual performance results subsequently achieved. One limitation of hypothetical performance is that it is generally prepared with the benefit of hindsight. In addition, no hypothetical track record can completely account for the impact of financial risk in actual trading. For example, back-factors that affect markets in general, the impact of fees and expenses, market liquidity and other factors may all have affected actual performance.
Actual Investor Experience Varies. The back-tested results are not indicative of the skill of Patton. For example, each Patton Investment Strategy began trading on the date indicated above. Back-tested performance shown for each Patton Investment Strategy reflects hypothetical performance determined using the current investment strategy of the applicable Patton Investment Strategy. However, Patton has been managing money using quantitative strategies since 2001. During this period Patton has experienced periods of poor performance and Patton has closed other Patton Investment Strategies that it has managed as a result of poor performance. Investors in some of Patton’s closed Strategies (and funds) have lost money.
Back-testing Period. During the back-tested period, Patton was either not providing investment advice or was not providing investment advice according to the Strategy used to calculate the back-tested results.
Indices. The historical performance of various indices, such as the S&P 500 Index, may be included. An index is an unmanaged, broad-based market index and investing in any Patton Investment Strategy is not similar to investing in an index. An index is not available for direct investment, and the securities in an index will not match the Strategy's holdings. In addition, unlike an index, the Strategy's performance will be affected by fees and expenses.
Forward-looking Statements. Any forward-looking statements represent the subjective views of Patton and their validity may be affected by events and conditions not now contemplated and by other factors, many of which may be beyond Patton's control. Actual results may vary and such variations may be material, and no representation or warranty is made regarding any forward-looking information contained herein.
Patton Strategy Composites
Patton Edge Strategy Actual Results.Performance results for February 2010 forward represents a dollar-weighted average of all accounts utilizing this strategy. The net return is the gross return reduced by 1/12 of 2.0% monthly. NOTE - an enhancement was made to the Strategy in March 2021 that is expected to have a meaningful impact on the performance of the Strategy in the future during the early months of a bull market.
Patton Edge Performance Statistics:
Start
End
Composite Return
Portfolio Count
Portfolio Count (End Period)
End Capital
12/31/2010
12/31/2011
9.53
3
8
1,692,849
12/31/2011
12/31/2012
11.26
5
8
1,683,360
12/31/2012
12/31/2013
27.11
6
11
2,236,018
12/31/2013
12/31/2014
11.93
8
14
1,188,751
12/31/2014
05/31/2015
0.00
14
17
1,697,507
12/31/2014
12/31/2015
5.29
13
19
1,656,694
12/31/2015
12/31/2016
-5.88
15
28
2,558,860
12/31/2016
12/31/2017
18.60
23
31
2,675,077
12/31/2017
12/31/2018
-4.54
14
18
994,749
12/31/2018
12/31/2019
15.06
14
14
841,753
12/31/2019
12/31/2020
-0.41
12
12
573,401
12/31/2020
12/31/2021
10.79
10
10
597,863
12/31/2021
12/31/2022
1.94
8
8
441,354
12/31/2022
12/31/2023
4.22
6
6
360,066
Patton Flex Strategy Actual Results.Performance results for February 2010 forward represents a dollar-weighted average of all accounts utilizing this strategy. The net return is the gross return reduced by 1/12 of 1.5% monthly. A performance-based fee structure is charged to some investors utilizing the Patton Flex Strategy that could result in higher fees than 1/12 of 1.5% annually. NOTE - an enhancement was made to the Strategy in March 2021 that is expected to have a meaningful impact on the performance of the Strategy in the future during the early months of a bull market.
Patton Flex Performance Statistics:
Start
End
Composite Return
Portfolio Count
Portfolio Count (End Period)
End Capital
01/31/2010
12/31/2010
13.85
1
1
1,142,400
12/31/2010
12/31/2011
22.48
1
1
1,739,954
12/31/2011
12/31/2012
34.24
1
1
3,114,146
12/31/2012
12/31/2013
68.92
1
1
5,074,023
12/31/2013
12/31/2014
22.43
1
1
11,795,197
12/31/2014
12/31/2015
25.79
1
1
24,493,849
12/31/2015
12/31/2016
-7.66
1
6
31,760,856
12/31/2016
12/31/2017
40.16
4
16
54,716,935
12/31/2017
12/31/2018
-13.95
15
42
61,359,349
12/31/2018
12/31/2019
17.73
29
45
79,211,768
12/31/2019
12/31/2020
-2.69
36
47
74,874,709
12/31/2020
12/31/2021
29.15
34
47
92,471,626
12/31/2021
12/31/2022
-2.55
41
49
88,897,349
07/31/2022
12/31/2022
-5.97
45
50
88,900,320
12/31/2022
12/31/2023
2.62
42
52
91,036,035
Audacity Performance Actual Results. Performance results for April 2020 forward represents a dollar-weighted average of all accounts utilizing this strategy. The net return is the gross return reduced by 1/12 of 4.0% monthly. A performance-based fee structure is charged to some investors utilizing the Audacity Strategy that could result in higher fees than the monthly management fee deducted from this data. NOTE - an enhancement was made to the Strategy in March 2021 that is expected to have a meaningful impact on the performance of the Strategy in the future during the early months of a bull market.
Audacity Performance Statistics:
Start
End
Composite Return
Portfolio Count
Portfolio Count (End Period)
End Capital
03/31/2020
12/31/2020
8.96
2
2
7,437,680
12/31/2020
12/31/2021
49.97
2
2
9,652,268
12/31/2021
12/31/2022
-7.29
2
2
11,523,894
12/31/2022
12/31/2023
-3.24
2
2
11,373,001
Notes about Composites:
"n/a" - Not statistically meaningful due to insufficient number of months.
Dispersion: Performance dispersion is calculated annually. Portfolios are only included that were in the strategy for the full year. Dispersion is calculated by subtracting the lowest portfolio return from the highest portfolio return.
Benchmark Description: The benchmark is the HFRX Equity Hedge index obtained from www.HedgeFundResearch.com. This is an investable index of long/short U.S. equity hedge funds. Its composition of securities and risk profile could be meaningfully different than the Patton Investment Strategy.
The above composite performance presentation for the Patton Edge Strategy and the underlying methodology used was independently verified by Ashland Partners only for the period through 12/31/2014. The above composite performance presentation for both the Patton Flex Strategy and Audacity Strategy and the underlying methodology used are identical to that of the Patton Edge Strategy.
Leverage: the Patton Edge Strategy can have up to two times gross exposure; the Patton Flex Strategy can have up to five times gross exposure; the Audacity Strategy can have up to eight times gross exposure.
The Patton Flex Fund, L.P., utilizing the Patton Flex Strategy, has a 0% management fee, 12% net annual hurdle, and a 50% incentive fee above the annual hurdle. See the Fund's Private Placement Memorandum for details. This fee structure can result in a meaningfully different net performance for investors.
The Audacity Fund, L.P., utilizing the Audacity Strategy, has a 2.0% management fee, 0% net annual hurdle, and a 20% incentive fee above the annual hurdle. See the Fund's Private Placement Memorandum for details. This fee structure can result in a meaningfully different net performance for investors.
Audacity Strategy Back-tested Performance: all performance is shown net of a 4.0% annual management fee. The Strategy is also offered with a 2.0% annual management fee and a 20% annual performance fee on all gains above 0%. Based upon research the 4.0% management fee structure is expected to be the lesser costly of the two fee structures.
Accounts are generally added to a Composite for the first full month invested and removed after the last full month invested.
The Strategy is sometimes carved out of accounts that contain other assets.
Super-Diversification Flex Growth Strategy
This is the actual NET performance of our clients utilizing our Super-Diversification Flex Growth Strategy totaling approximately $119,465,854 of assets. Our Strategy and process has remained consistent over the entire period. Not all Patton Clients with the same strategy experienced the same performance due primarly to minor differences in allocations and differences in fees. A very limited number of Patton Clients pay fees from money outside of their portfolio resulting in a higher return. Some clients are Qualified Clients and Accredited Investors as defined by the SEC and may pay a performance-based fee which can meaningfully impact performance.
Use of leverage on a portion of the portfolios represented by this composite return has had a material impact on the performance figures displayed.
Performance includes the reinvestment of dividends and other earnings. Investors may lose money, and are expected to lose money, during significant market declines and other market conditions, in this strategy.
The asset allocation of the strategy has been different than the ARC Private Client Index, resulting in differing performance, although the risk profiles of both have been generally similar. During the period being reported the market has been in an upward trend that has been stronger than historic averages. There is no assurance that this type of trend will persist or how we would perform if it did.
All other representations of Super-Diversification performance throughout our website is back-tested simulated results unless otherwise noted.
ARC Private Client Index
The ARC Private Client Index is an index created by and maintained by the ARC Group. These indexes consist of more than 350,000+ actual investor portfolio returns that are managed by 138 investment managers (as of April 2024) including some of the largest in the world. These 138 managers only represent a sample of the 10,000's of investment managers and other such service providers (financial planners, traditional brokers, etc.).
There are 4 Private Client Indexes each with a different risk profile. We have selected the ARC Private Client Index with the most comparable risk profile, Steady Growth (allocation approximately 46.83% equities, 21.03% Fixed Income, 4.20% Cash, and 27.94% Other as of April 2024), to our Patton Clients performance.
For more information about these indexes, visit the ARC Group's website here.
Industry benchmarks presented for comparison to Super-Diversified Portfolios are believed to be comparable risk portfolios although the holdings are very likely significantly different. Simulated portfolio benchmarks, such as a "Traditional Portfolio", does have a similar risk profile but is allocated only to traditional asset classes of stocks, bonds, and cash.
IMPORTANT NOTICE: INFORMATION ABOUT MODEL PORTFOLIO PERFORMANCE
Unless otherwise noted, the performance of all portfolios ("Model Portfolios") are simulations of various combinations of asset classes used to simulate the performance of various types of portfolios with various risk profiles. All Model Portfolios for all time periods are back-tested hypothetical simulated results.
Model Portfolios have been developed based on historical performance of the described indexes for the relevant time period using our proprietary process and do not represent the results of actual trading of investor assets. Model performance has inherent limitations. Since these are simulated portfolios (hypothetical) and do not reflect any investor's actual experience with owning, trading or managing an actual investment account, there can be no assurance that an investor would have achieved similar rates of return over the time frame. Thus, the performance shown does not reflect the impact that material economic and market factors had or might have had on decision making if actual investor money had been managed. In addition, since the time period in question is a historical one, there can be no assurance that future results achieved by investors will in any way resemble those represented by the Model Portfolios. Model Portfolios are rebalanced monthly. All performance data is total returns which includes interest and dividends. The calculations are net of the estimated management and/or performance fees, trading costs, and fund expense ratios (see below table for estimated expense ratios by Asset Class) if applicable. Performance does not reflect the deduction of other fees or expenses, including but not limited to brokerage account fees, custodial fees, and fees and expenses charged by mutual funds, exchange traded funds, and other investment companies that may be in addition to the expense ratio (these additional expenses tend to be extremely low).
The following describes how a model portfolio monthly return is calculated:
Portfolio Allocation: 50% U.S. Large-Cap, 50% U.S. Aggregate Bonds
Portfolio Fees: 1.2% annually or 0.1% per month
Month's Performance: U.S. Large-Cap = +3.0%, U.S. Aggregate Bonds = +1.0%
Portfolio Performance: (50% x 3.0%) + (50% x 1.0%) = +2.0% less 0.1% (fees) = +1.9%
Model Portfolios presented on our website are portfolios blended from various indexes. The blended asset allocation of every Model Portfolio is readily available within the website. The benchmark index(es) used to represent each asset class is disclosed elsewhere in this disclosure. We do adjust the performance of the benchmark indexes for fees of an applicable fund available to invest in that index or asset class.
When a Model Portfolio's performance is compared to a single benchmark index, such as the S&P 500, the index has not been selected to represent an appropriate benchmark to compare an investor's performance, but rather are disclosed to allow for comparison of the investor's performance, for the convenience of the investor, to that of certain well-known and widely recognized indices. Indices are typically not available for direct investment, are unmanaged, and do not incur fees or expenses.
The goal of a portfolio is not to outperform and single index. The objective of a portfolio is total return. All portfolios are subject to the risk of loss. Patton was not necessarily managing portfolios similar to any given model portfolio. Model Portfolios are not indicative of the skill of Patton nor the performance of portfolios managed by Patton.
The performance calculations of all Model Portfolios have not been audited by any third party. Actual performance of client portfolios may differ materially due to the timing related to additional client deposits or withdrawals and the actual deployment and investment of a client portfolio, the length of time various positions are held, the client’s objectives and restrictions, and fees and expenses incurred by any specific individual portfolio.
Any presentation of two portfolios for comparison is intended to have a similar risk profile. Some Model Portfolios are more diversified than others such as Patton's Super-Diversified Portfolios generally including more asset classes than more traditional portfolios. Generally the purpose of such presentations is to demonstrate the impact of added diversification.
Although we have done our best to present this information fairly, hypothetical performance is still potentially misleading. Hypothetical data does not represent actual performance and should not be interpreted as an indication of actual performance. This data is based on transactions that were not made. Instead, the trades were simulated, based on knowledge that was available only after the fact and thus with the benefit of hindsight. Results do not include the impact of taxes, if any. Past performance is not indicative of future performance.
General Information
This website content is subject to change without notice and, due to the rapidly changing nature of the security markets, may quickly become outdated. All materials presented are compiled by Patton from sources believed to be reliable and current, but accuracy cannot be guaranteed. This information is distributed for education purposes, and it is not to be construed as an offer, solicitation, recommendation, or endorsement of any particular security, product, or service. Content is prohibited from being reproduced.
Diversification does not ensure a profit or protect against a loss in a declining market.
Investments involve risk and unless otherwise state, are not guaranteed. Consider the investment objectives, risks, and expenses carefully before investing.
Readers of the information contained on this website should be aware that any action taken by the viewer/reader based on this information is taken at their own risk. This information does not address individual situations and should not be construed or viewed as any type of individual or group recommendation. Be sure to first consult with a qualified financial adviser, tax professional, and/or legal counsel before implementing any securities, investments, or investment strategies discussed.
Exchange-Traded Funds and Index Mutual Funds (“Index Funds”). All Index Funds are subject to risk, which may result in the loss of principal. International Index Funds involve additional risks, including currency fluctuations and political uncertainty. Index Fund products that invest in emerging markets are generally more risky than those that invest in developed countries because countries with emerging markets may have relatively unstable and less-established markets and economies. Sector Index Funds are subject to sector risks and non-diversification risks, which may result in performance fluctuations that are more extreme than fluctuations in the overall stock market. In addition, sector Index Funds that sample their target indexes to comply with tax diversification rules may experience a greater degree of tracking error than other Index Funds. Prices of mid- and small-cap stocks often fluctuate more than those of large-company stocks.
Source Data for Analysis
Any analysis reflecting daily performance for any Patton Investment Strategy is an actual data for the periods available and back-tested data for prior periods. Daily data for diversified portfolios uses an applicable index fund (see the Asset Classes table in this Disclosure "Index Fund" column) performance less the applicable fees.
Mutual fund performance and performance statistics come from Steele Mutual Fund Expert (https://steelesystems.com/).
Client Performance Reporting
Client performance reporting, illustrated as the "Family", in the password protected areas of our webiste, including our Super-Diversified Portfolio Statements section, does represent the actual performance of an individual client's portfolio. Returns are shown net of fees, deposits, and withdrawals. These returns are calculated consistent with industry standards (returns are linked for periods upon a deposit or withdrawal).
Every effort is made to insure correct calculations. Please notify Patton if you believe your returns do not appear correct.
For clients with an investment in a Patton hedge fund / L.P., all current date valuations and daily returns for hedge fund investments are an estimate. These estimates are based on your most recent actual month-end balance, if applicable, and incremented by the estimated daily percent change. Month-end market valuations are actual once the hedge fund statement has been posted to the website.
Performance for specific asset classes does NOT represent the actual performance for the client; this performance is for the asset class based on the assumptions and descriptions made in our Asset Classes Descriptions in our full disclosure.
Any reference to the "Benchmark" portfolio is a simulated portfolio. This does not represent actual returns. It is used as a simulated benchmark to compare to the client's actual performance. See the "Benchmark Portfolio" report in the Dashboard reports for details about the asset allocation and more of the Benchmark Portfolio.
Portfolio Performance Composites
We have multiple portfolio performance composites. Each portfolio performance composite represents a different portfolio strategy and a different risk profile. Generally all Patton client portfolios that meet the minimum value, typically $100,000, are included in one of the portfolio performance composites. Portfolios may be excluded for various reasons and periods of time when it is deemed their performance is not representative of the Composite (example: use of margin). Portfolios are generally added to a Composite for the first full month it is invested and removed after the last full month it is invested. The result is multiple performance composites consisting of all like-type (strategy and risk profile) Patton client portfolios.
Following are the strategies for the portfolio performance composites:
Super-Diversified with Flex: diversified portfolios including an allocation to the Patton Flex Strategy or Patton Flex Fund, L.P.
Super-Diversified with Audacity: diversified portfolios including an allocation to the Audacity Strategy or Audacity Fund, L.P.
Better-Diversified: diversified portfolios without an allocation to any Patton strategy
The three diversified portfolio performance composites are further separated by the following risk profiles: Conservative, Moderate, and Growth.
All references to "Patton Clients" on our website represents the Super-Diversified with Flex performance composite for the Growth risk profile.
Use of leverage on a portion of the portfolios represented by this composite return has had a material impact on the performance figures displayed.
Performance is calculated as a dollar-weighted average meaning that larger accounts have a larger impact on the composite average.
Performance is shown net of client fees.
The following table provides details for each portfolio performance composite:
Portfolio Performance Composite Details
Performance
Date
Composite
Client Count
Client Assets
02/28/2010
-1.02%
1
2,813,735
02/28/2010
0.22%
1
860,504
02/28/2010
1.99%
1
459,585
02/28/2010
2.44%
1
157,368
02/28/2010
2.65%
1
1,278,543
02/28/2010
2.65%
1
1,278,543
02/28/2010
3.00%
2
771,810
02/28/2010
3.76%
2
1,336,988
02/28/2010
5.09%
2
850,555
03/31/2010
2.26%
1
872,901
03/31/2010
3.13%
1
473,941
03/31/2010
3.39%
1
1,321,851
03/31/2010
3.39%
1
1,321,851
03/31/2010
3.60%
2
266,296
03/31/2010
3.79%
2
801,196
03/31/2010
8.31%
2
921,205
03/31/2010
9.05%
1
2,947,202
03/31/2010
9.42%
2
1,398,989
04/30/2010
0.30%
1
1,441,106
04/30/2010
0.30%
1
1,441,106
04/30/2010
0.72%
2
927,576
04/30/2010
1.19%
2
810,995
04/30/2010
1.24%
1
479,910
04/30/2010
1.74%
3
675,594
04/30/2010
2.84%
2
1,412,357
04/30/2010
3.23%
1
888,044
04/30/2010
4.60%
1
3,003,168
05/31/2010
-7.08%
2
851,554
05/31/2010
-5.75%
3
637,248
05/31/2010
-5.70%
2
1,333,337
05/31/2010
-4.51%
2
774,285
05/31/2010
-4.47%
1
458,425
05/31/2010
-3.46%
1
2,899,045
05/31/2010
-0.10%
1
1,440,223
05/31/2010
-0.10%
1
1,440,223
05/31/2010
-0.04%
1
886,585
06/30/2010
-9.21%
2
772,867
06/30/2010
-2.23%
1
2,860,101
06/30/2010
-0.51%
1
1,586,078
06/30/2010
-0.51%
1
1,586,078
06/30/2010
-0.50%
2
770,619
06/30/2010
-0.37%
2
1,327,316
06/30/2010
-0.34%
3
635,852
06/30/2010
1.12%
1
463,588
06/30/2010
4.56%
1
907,154
07/31/2010
0.89%
1
1,600,636
07/31/2010
0.89%
1
1,600,636
07/31/2010
3.20%
1
478,386
07/31/2010
3.72%
2
799,238
07/31/2010
3.75%
3
1,887,802
07/31/2010
3.75%
1
2,906,405
07/31/2010
3.91%
2
1,459,963
07/31/2010
5.11%
3
668,177
07/31/2010
5.79%
2
817,869
08/31/2010
-5.80%
2
745,128
08/31/2010
-4.05%
3
1,844,964
08/31/2010
-2.10%
1
2,871,113
08/31/2010
-1.75%
1
1,169,467
08/31/2010
-1.47%
2
1,466,267
08/31/2010
-1.14%
2
790,146
08/31/2010
-0.86%
3
662,481
08/31/2010
-0.02%
1
478,354
08/31/2010
0.66%
1
1,192,384
08/31/2010
2.23%
1
119,409
09/30/2010
-0.19%
1
1,072,749
09/30/2010
-0.19%
1
1,072,749
09/30/2010
1.98%
1
121,794
09/30/2010
4.38%
2
824,690
09/30/2010
4.50%
1
499,989
09/30/2010
5.76%
3
700,676
09/30/2010
7.43%
2
1,501,957
09/30/2010
9.88%
1
3,012,465
09/30/2010
10.88%
1
214,524
09/30/2010
10.88%
3
1,943,774
10/31/2010
0.23%
1
122,038
10/31/2010
0.87%
1
504,349
10/31/2010
1.10%
1
1,151,313
10/31/2010
1.10%
1
1,151,313
10/31/2010
1.13%
3
708,819
10/31/2010
1.21%
1
3,048,665
10/31/2010
1.28%
2
835,266
10/31/2010
1.66%
2
1,518,380
10/31/2010
2.24%
3
1,987,389
10/31/2010
4.15%
2
851,157
11/30/2010
-1.25%
1
120,530
11/30/2010
-0.95%
3
702,071
11/30/2010
-0.85%
1
1,141,385
11/30/2010
-0.85%
1
1,141,385
11/30/2010
-0.84%
3
1,973,588
11/30/2010
-0.49%
1
500,018
11/30/2010
-0.48%
2
831,439
11/30/2010
-0.34%
2
1,507,515
11/30/2010
0.28%
1
3,000,477
11/30/2010
1.71%
2
865,824
12/31/2010
-0.76%
1
119,624
12/31/2010
0.10%
1
1,142,400
12/31/2010
0.10%
1
1,142,400
12/31/2010
0.99%
2
1,509,912
12/31/2010
1.05%
2
1,523,997
12/31/2010
1.71%
1
4,155,828
12/31/2010
3.08%
1
3,092,127
12/31/2010
3.17%
2
1,509,912
12/31/2010
3.28%
2
858,710
12/31/2010
3.30%
1
424,236
12/31/2010
3.93%
3
729,696
12/31/2010
5.17%
2
890,733
01/31/2011
-0.22%
1
1,130,512
01/31/2011
0.07%
1
4,158,834
01/31/2011
0.13%
1
119,751
01/31/2011
0.25%
2
860,903
01/31/2011
0.25%
2
1,527,259
01/31/2011
0.33%
2
1,514,679
01/31/2011
0.33%
2
1,514,679
01/31/2011
0.39%
3
732,530
01/31/2011
0.60%
1
426,735
01/31/2011
0.83%
1
1,152,024
01/31/2011
1.44%
3
1,092,983
01/31/2011
14.46%
1
3,106,906
02/28/2011
-11.09%
1
3,195,012
02/28/2011
1.17%
1
121,154
02/28/2011
1.45%
1
1,201,195
02/28/2011
1.45%
1
1,201,195
02/28/2011
2.25%
2
1,561,848
02/28/2011
2.57%
1
4,265,778
02/28/2011
2.92%
2
885,913
02/28/2011
2.96%
1
439,430
02/28/2011
3.06%
3
754,862
02/28/2011
3.25%
2
1,563,578
02/28/2011
3.25%
2
1,563,578
02/28/2011
3.49%
3
1,131,021
03/31/2011
-1.44%
1
1,183,906
03/31/2011
-1.44%
1
1,183,906
03/31/2011
-0.08%
1
121,067
03/31/2011
0.02%
1
4,265,396
03/31/2011
0.08%
1
3,147,406
03/31/2011
0.09%
2
1,563,365
03/31/2011
0.32%
3
2,111,465
03/31/2011
0.32%
3
2,111,465
03/31/2011
0.35%
3
757,372
03/31/2011
0.42%
1
441,175
03/31/2011
0.43%
2
950,170
03/31/2011
1.04%
3
1,142,789
04/30/2011
0.17%
1
1,227,265
04/30/2011
0.17%
1
1,227,265
04/30/2011
2.52%
2
974,315
04/30/2011
2.57%
1
4,375,424
04/30/2011
2.63%
1
124,268
04/30/2011
2.68%
2
1,604,862
04/30/2011
2.93%
1
3,240,220
04/30/2011
2.93%
1
454,146
04/30/2011
3.12%
4
940,317
04/30/2011
3.22%
2
1,881,876
04/30/2011
3.22%
2
1,881,876
04/30/2011
3.24%
3
1,149,138
05/31/2011
-1.33%
3
2,149,946
05/31/2011
-1.33%
3
2,149,946
05/31/2011
-1.25%
2
962,025
05/31/2011
-1.16%
1
448,884
05/31/2011
-1.15%
4
929,549
05/31/2011
-0.59%
3
1,142,659
05/31/2011
-0.43%
1
4,356,579
05/31/2011
-0.12%
2
1,602,742
05/31/2011
0.66%
1
1,435,618
05/31/2011
0.66%
1
1,435,618
05/31/2011
0.97%
1
125,494
05/31/2011
3.20%
1
2,721,099
06/30/2011
-2.19%
1
439,013
06/30/2011
-2.15%
4
909,028
06/30/2011
-1.55%
2
424,771
06/30/2011
-1.53%
1
123,567
06/30/2011
-1.43%
1
2,681,971
06/30/2011
-1.41%
2
948,313
06/30/2011
-0.68%
2
1,635,507
06/30/2011
-0.64%
1
4,327,495
06/30/2011
-0.60%
3
2,137,255
06/30/2011
-0.60%
3
2,137,255
06/30/2011
2.73%
1
1,518,794
06/30/2011
2.73%
1
1,518,794
07/31/2011
-2.40%
3
1,088,326
07/31/2011
-1.05%
1
1,502,394
07/31/2011
-1.05%
1
1,502,394
07/31/2011
-0.02%
4
2,755,780
07/31/2011
-0.02%
1
2,622,661
07/31/2011
-0.02%
4
2,755,780
07/31/2011
0.01%
5
1,817,858
07/31/2011
0.23%
2
950,747
07/31/2011
0.24%
1
439,950
07/31/2011
0.48%
1
4,347,839
07/31/2011
0.80%
2
1,704,733
07/31/2011
2.11%
1
126,172
08/31/2011
-6.06%
3
1,022,837
08/31/2011
-3.50%
4
2,660,014
08/31/2011
-3.50%
4
2,660,014
08/31/2011
-2.28%
1
429,884
08/31/2011
-2.28%
5
1,776,146
08/31/2011
-1.48%
2
936,957
08/31/2011
-0.97%
2
1,686,004
08/31/2011
-0.69%
1
2,604,500
08/31/2011
-0.35%
1
4,332,719
08/31/2011
2.06%
1
113,494
08/31/2011
7.32%
1
1,462,787
08/31/2011
7.32%
1
1,462,787
09/30/2011
-10.43%
2
349,054
09/30/2011
-6.18%
5
1,666,129
09/30/2011
-5.30%
1
407,123
09/30/2011
-4.81%
4
2,532,186
09/30/2011
-4.81%
4
2,532,186
09/30/2011
-3.75%
1
4,170,624
09/30/2011
-3.68%
2
902,291
09/30/2011
-1.68%
2
1,656,889
09/30/2011
-0.89%
1
2,581,617
09/30/2011
0.37%
2
216,842
09/30/2011
4.24%
1
1,524,712
09/30/2011
4.24%
1
1,524,712
10/31/2011
-2.09%
1
1,492,902
10/31/2011
-2.09%
1
1,492,902
10/31/2011
2.10%
2
221,371
10/31/2011
3.46%
2
1,713,886
10/31/2011
4.21%
1
4,345,771
10/31/2011
5.23%
1
2,716,516
10/31/2011
5.93%
2
956,000
10/31/2011
5.95%
4
2,682,175
10/31/2011
5.95%
4
2,682,175
10/31/2011
7.95%
1
439,510
10/31/2011
8.10%
5
1,802,230
10/31/2011
11.24%
3
1,008,274
11/30/2011
-2.74%
3
980,773
11/30/2011
-0.52%
1
437,226
11/30/2011
-0.32%
6
1,918,713
11/30/2011
-0.06%
2
221,294
11/30/2011
0.07%
1
4,348,533
11/30/2011
0.34%
2
959,238
11/30/2011
0.58%
1
2,673,541
11/30/2011
0.69%
2
1,725,245
11/30/2011
0.70%
4
2,674,875
11/30/2011
0.70%
4
2,674,875
11/30/2011
10.08%
1
1,615,486
11/30/2011
10.08%
1
1,615,486
12/31/2011
-0.29%
6
1,913,707
12/31/2011
0.02%
3
953,926
12/31/2011
0.26%
1
438,420
12/31/2011
0.56%
1
4,374,241
12/31/2011
0.62%
3
1,068,266
12/31/2011
1.11%
2
223,825
12/31/2011
1.35%
4
2,708,428
12/31/2011
1.35%
4
2,708,428
12/31/2011
1.64%
1
2,717,184
12/31/2011
1.86%
2
1,756,639
12/31/2011
7.71%
1
1,739,954
12/31/2011
7.71%
1
1,739,954
01/31/2012
-6.13%
1
1,866,457
01/31/2012
-6.13%
1
1,866,457
01/31/2012
0.67%
2
1,768,736
01/31/2012
1.45%
5
2,951,565
01/31/2012
1.45%
5
2,951,565
01/31/2012
2.04%
3
973,436
01/31/2012
2.30%
2
228,964
01/31/2012
2.43%
1
2,783,574
01/31/2012
2.65%
3
1,096,684
01/31/2012
2.89%
1
4,500,901
01/31/2012
4.26%
1
457,061
01/31/2012
4.44%
6
1,999,558
02/29/2012
0.10%
2
229,115
02/29/2012
1.61%
1
4,573,802
02/29/2012
1.82%
1
465,483
02/29/2012
1.85%
6
2,037,241
02/29/2012
2.04%
2
1,804,917
02/29/2012
2.31%
4
4,049,105
02/29/2012
3.04%
6
3,197,958
02/29/2012
3.04%
6
3,197,958
02/29/2012
3.72%
3
1,009,813
02/29/2012
4.14%
1
1,943,670
02/29/2012
4.14%
1
1,943,670
02/29/2012
4.82%
1
2,846,108
03/31/2012
-0.92%
2
216,897
03/31/2012
0.11%
1
465,889
03/31/2012
0.42%
6
2,046,131
03/31/2012
1.84%
1
4,658,554
03/31/2012
1.92%
1
2,847,957
03/31/2012
2.23%
4
4,137,954
03/31/2012
2.37%
2
1,949,491
03/31/2012
3.80%
3
1,048,764
03/31/2012
4.48%
6
3,341,436
03/31/2012
4.48%
6
3,341,436
03/31/2012
14.86%
1
2,370,736
03/31/2012
14.86%
1
2,370,736
04/30/2012
0.36%
6
2,054,005
04/30/2012
0.55%
2
387,250
04/30/2012
0.61%
1
468,724
04/30/2012
0.94%
4
4,178,579
04/30/2012
1.67%
2
220,581
04/30/2012
1.95%
2
1,986,877
04/30/2012
1.98%
1
2,904,171
04/30/2012
2.31%
6
3,415,476
04/30/2012
2.31%
6
3,415,476
04/30/2012
9.15%
1
2,587,528
04/30/2012
9.15%
1
2,587,528
05/31/2012
-6.23%
2
363,121
05/31/2012
-4.19%
6
1,968,413
05/31/2012
-4.09%
5
4,738,219
05/31/2012
-4.01%
1
128,923
05/31/2012
-3.42%
5
2,036,338
05/31/2012
-3.42%
5
2,036,338
05/31/2012
-2.30%
1
2,577,967
05/31/2012
-2.30%
1
2,577,967
05/31/2012
-2.08%
2
1,945,535
05/31/2012
-1.89%
1
2,849,703
05/31/2012
0.18%
2
220,981
06/30/2012
0.93%
2
222,997
06/30/2012
1.94%
2
1,982,797
06/30/2012
2.20%
5
4,843,295
06/30/2012
2.32%
1
2,853,233
06/30/2012
2.35%
2
371,643
06/30/2012
2.41%
1
2,822,732
06/30/2012
2.41%
1
2,822,732
06/30/2012
2.78%
6
2,190,046
06/30/2012
2.78%
6
2,190,046
06/30/2012
2.82%
1
132,569
06/30/2012
2.83%
6
2,023,870
07/31/2012
-0.71%
2
369,080
07/31/2012
1.28%
6
2,048,844
07/31/2012
1.64%
2
226,665
07/31/2012
1.74%
1
134,865
07/31/2012
1.86%
5
4,932,352
07/31/2012
2.29%
2
2,026,977
07/31/2012
2.71%
1
2,929,988
07/31/2012
3.43%
6
2,259,687
07/31/2012
3.43%
6
2,259,687
07/31/2012
9.13%
1
3,080,508
07/31/2012
9.13%
1
3,080,508
08/31/2012
-4.48%
1
2,942,061
08/31/2012
-4.48%
1
2,942,061
08/31/2012
-0.14%
6
2,232,543
08/31/2012
-0.14%
6
2,232,543
08/31/2012
0.24%
2
227,250
08/31/2012
0.26%
1
2,937,600
08/31/2012
0.34%
2
2,033,491
08/31/2012
0.60%
5
4,960,964
08/31/2012
1.41%
1
136,724
08/31/2012
1.42%
6
2,078,906
08/31/2012
3.10%
2
380,513
09/30/2012
0.12%
2
227,522
09/30/2012
0.77%
1
137,814
09/30/2012
0.96%
1
2,905,160
09/30/2012
1.12%
2
2,056,171
09/30/2012
1.30%
6
2,105,600
09/30/2012
1.68%
5
5,044,081
09/30/2012
1.96%
6
2,299,843
09/30/2012
1.96%
6
2,299,843
09/30/2012
2.38%
1
3,036,075
09/30/2012
2.38%
1
3,036,075
09/30/2012
3.03%
2
392,047
10/31/2012
-3.11%
1
2,941,381
10/31/2012
-3.11%
1
2,941,381
10/31/2012
-1.50%
6
2,265,752
10/31/2012
-1.50%
6
2,265,752
10/31/2012
-1.15%
1
136,250
10/31/2012
-1.13%
6
2,082,036
10/31/2012
-1.09%
5
4,987,134
10/31/2012
-1.02%
1
2,875,441
10/31/2012
-1.01%
2
2,036,372
10/31/2012
-0.99%
2
388,128
10/31/2012
-0.67%
2
218,031
11/30/2012
0.91%
2
220,050
11/30/2012
1.00%
1
137,569
11/30/2012
1.11%
6
2,105,183
11/30/2012
1.32%
5
5,051,079
11/30/2012
1.35%
1
2,914,493
11/30/2012
1.49%
2
2,066,707
11/30/2012
1.62%
2
394,405
11/30/2012
2.11%
6
2,313,906
11/30/2012
2.11%
6
2,313,906
11/30/2012
4.75%
1
3,081,334
11/30/2012
4.75%
1
3,081,334
12/31/2012
-1.37%
1
3,114,146
12/31/2012
-1.37%
1
3,114,146
12/31/2012
-1.16%
1
2,912,197
12/31/2012
-0.24%
2
219,542
12/31/2012
0.57%
2
2,078,803
12/31/2012
0.64%
7
3,834,232
12/31/2012
0.64%
7
3,834,232
12/31/2012
1.16%
5
5,109,094
12/31/2012
1.27%
1
139,328
12/31/2012
1.48%
6
2,135,176
12/31/2012
1.78%
2
383,204
01/31/2013
0.08%
2
219,733
01/31/2013
2.77%
2
2,136,948
01/31/2013
2.87%
1
143,313
01/31/2013
2.94%
5
1,178,418
01/31/2013
4.00%
5
5,372,991
01/31/2013
5.11%
7
4,028,607
01/31/2013
5.11%
7
4,028,607
01/31/2013
6.33%
2
407,439
01/31/2013
8.17%
1
2,969,046
01/31/2013
10.85%
1
3,450,899
01/31/2013
10.85%
1
3,450,899
02/28/2013
-0.24%
1
3,442,863
02/28/2013
0.32%
1
143,739
02/28/2013
0.53%
5
1,590,833
02/28/2013
0.73%
2
410,430
02/28/2013
0.76%
1
112,167
02/28/2013
1.14%
4
4,827,004
02/28/2013
1.22%
2
2,162,660
02/28/2013
1.81%
7
4,103,577
02/28/2013
1.81%
7
4,103,577
02/28/2013
2.62%
1
3,010,133
02/28/2013
4.89%
1
3,628,429
03/31/2013
0.51%
1
112,770
03/31/2013
1.52%
1
145,919
03/31/2013
1.74%
5
1,618,007
03/31/2013
2.40%
2
2,214,553
03/31/2013
2.84%
4
5,985,124
03/31/2013
3.42%
1
3,109,209
03/31/2013
4.13%
7
4,275,319
03/31/2013
4.13%
7
4,275,319
03/31/2013
4.19%
1
4,220,423
03/31/2013
4.19%
1
4,220,423
03/31/2013
4.58%
2
429,176
04/30/2013
-0.37%
3
1,137,575
04/30/2013
0.63%
1
3,825,850
04/30/2013
0.63%
1
3,825,850
04/30/2013
0.71%
8
5,084,877
04/30/2013
0.71%
8
5,084,877
04/30/2013
1.15%
2
2,239,307
04/30/2013
1.36%
4
6,065,000
04/30/2013
1.53%
1
114,497
04/30/2013
1.83%
6
2,289,092
04/30/2013
2.13%
1
149,035
04/30/2013
2.86%
1
3,139,930
05/31/2013
-2.12%
1
112,067
05/31/2013
-1.75%
1
146,402
05/31/2013
-1.33%
6
2,259,715
05/31/2013
-0.30%
2
2,232,983
05/31/2013
-0.08%
4
6,400,147
05/31/2013
0.63%
1
3,159,772
05/31/2013
0.80%
1
92,341
05/31/2013
1.21%
8
5,146,004
05/31/2013
1.21%
8
5,146,004
05/31/2013
4.06%
3
1,183,764
05/31/2013
5.91%
1
4,052,190
05/31/2013
5.91%
1
4,052,190
06/30/2013
-4.48%
3
1,130,883
06/30/2013
-2.83%
6
2,195,830
06/30/2013
-2.65%
1
295,692
06/30/2013
-2.40%
1
142,911
06/30/2013
-2.33%
1
3,086,130
06/30/2013
-2.28%
4
6,255,454
06/30/2013
-2.11%
1
109,684
06/30/2013
-1.88%
8
5,057,424
06/30/2013
-1.88%
8
5,057,424
06/30/2013
-1.84%
2
2,190,856
06/30/2013
-0.12%
1
4,070,509
06/30/2013
-0.12%
1
4,070,509
07/31/2013
0.74%
1
110,489
07/31/2013
1.40%
1
4,127,074
07/31/2013
1.40%
1
4,127,074
07/31/2013
2.00%
2
2,234,901
07/31/2013
2.75%
4
6,430,127
07/31/2013
2.79%
8
5,247,480
07/31/2013
2.79%
8
5,247,480
07/31/2013
2.95%
1
3,116,473
07/31/2013
3.12%
1
147,348
07/31/2013
3.38%
6
2,269,184
07/31/2013
3.59%
1
306,233
07/31/2013
5.80%
3
1,187,328
08/31/2013
-6.65%
1
3,952,439
08/31/2013
-6.65%
1
3,952,439
08/31/2013
-3.84%
8
5,044,261
08/31/2013
-3.84%
8
5,044,261
08/31/2013
-3.59%
3
1,144,338
08/31/2013
-3.05%
2
2,166,982
08/31/2013
-2.94%
1
3,024,404
08/31/2013
-2.46%
4
6,276,041
08/31/2013
-2.38%
1
298,989
08/31/2013
-2.32%
6
2,217,228
08/31/2013
-2.27%
1
143,991
08/31/2013
-1.35%
1
109,001
08/31/2013
-1.18%
1
147,171
09/30/2013
1.42%
1
149,291
09/30/2013
1.61%
1
110,758
09/30/2013
2.57%
1
147,702
09/30/2013
2.94%
4
6,462,100
09/30/2013
3.20%
6
2,287,679
09/30/2013
3.25%
1
308,728
09/30/2013
3.44%
1
3,128,164
09/30/2013
3.52%
2
2,243,396
09/30/2013
4.31%
8
5,258,712
09/30/2013
4.31%
8
5,258,712
09/30/2013
5.53%
1
4,170,636
09/30/2013
5.86%
3
1,211,051
09/30/2013
11.51%
1
4,176,526
10/31/2013
-0.80%
1
4,239,524
10/31/2013
-0.80%
1
4,239,524
10/31/2013
0.93%
1
150,669
10/31/2013
1.12%
1
111,992
10/31/2013
1.84%
4
6,583,215
10/31/2013
2.10%
2
2,290,904
10/31/2013
2.25%
1
330,023
10/31/2013
2.30%
6
2,339,938
10/31/2013
2.33%
1
151,126
10/31/2013
2.62%
8
5,590,673
10/31/2013
2.62%
8
5,590,673
10/31/2013
3.32%
1
3,173,775
10/31/2013
4.20%
3
1,251,097
11/30/2013
-0.61%
1
111,298
11/30/2013
-0.18%
1
150,845
11/30/2013
-0.05%
6
2,337,596
11/30/2013
0.08%
1
150,817
11/30/2013
0.31%
1
331,094
11/30/2013
0.99%
4
6,645,809
11/30/2013
1.51%
2
2,325,489
11/30/2013
3.02%
2
3,370,408
11/30/2013
3.17%
2
1,050,982
11/30/2013
3.43%
8
5,829,033
11/30/2013
3.43%
8
5,829,033
11/30/2013
15.53%
1
4,857,468
11/30/2013
15.53%
1
4,857,468
12/31/2013
-0.97%
1
110,223
12/31/2013
-0.24%
1
150,466
12/31/2013
0.31%
6
2,344,681
12/31/2013
0.59%
1
151,729
12/31/2013
0.61%
1
333,058
12/31/2013
0.64%
1
1,251,199
12/31/2013
0.89%
4
6,705,317
12/31/2013
1.86%
2
3,433,349
12/31/2013
1.96%
8
5,948,563
12/31/2013
1.96%
8
5,948,563
12/31/2013
2.05%
1
5,074,023
12/31/2013
2.05%
1
5,074,023
12/31/2013
2.58%
3
1,301,377
01/31/2014
-15.87%
1
4,485,357
01/31/2014
-9.04%
1
4,642,895
01/31/2014
-4.47%
8
5,721,319
01/31/2014
-4.47%
8
5,721,319
01/31/2014
-2.37%
2
3,350,772
01/31/2014
-2.30%
3
1,271,550
01/31/2014
-1.63%
4
6,594,185
01/31/2014
-1.55%
1
327,842
01/31/2014
-1.30%
6
2,315,016
01/31/2014
-1.27%
1
1,235,456
01/31/2014
-1.18%
1
149,962
01/31/2014
0.14%
1
150,695
01/31/2014
1.33%
1
111,671
02/28/2014
0.56%
1
113,057
02/28/2014
1.82%
1
153,396
02/28/2014
3.50%
1
155,190
02/28/2014
3.64%
5
1,734,817
02/28/2014
3.89%
1
340,605
02/28/2014
3.93%
4
6,807,985
02/28/2014
4.00%
2
2,377,623
02/28/2014
4.51%
1
106,662
02/28/2014
5.23%
9
6,257,514
02/28/2014
5.23%
9
6,257,514
02/28/2014
5.73%
3
1,344,329
02/28/2014
6.87%
1
5,183,008
03/31/2014
-1.53%
3
1,323,816
03/31/2014
0.12%
1
113,170
03/31/2014
0.24%
1
153,400
03/31/2014
0.47%
5
1,744,499
03/31/2014
0.58%
1
362,774
03/31/2014
0.73%
3
1,205,324
03/31/2014
0.78%
1
107,331
03/31/2014
0.87%
1
156,549
03/31/2014
0.94%
2
2,394,863
03/31/2014
1.05%
9
6,640,859
03/31/2014
1.05%
9
6,640,859
03/31/2014
1.57%
1
6,236,042
03/31/2014
3.66%
1
7,488,924
04/30/2014
-3.73%
1
105,040
04/30/2014
-1.74%
3
1,300,101
04/30/2014
-1.54%
1
7,498,719
04/30/2014
-0.71%
12
12,835,826
04/30/2014
-0.71%
12
12,835,826
04/30/2014
-0.05%
1
154,112
04/30/2014
0.16%
1
158,201
04/30/2014
0.25%
2
2,401,907
04/30/2014
0.58%
1
364,893
04/30/2014
0.62%
3
1,213,137
04/30/2014
0.73%
5
1,764,023
04/30/2014
0.79%
1
114,057
04/30/2014
2.92%
1
7,498,719
05/31/2014
1.35%
1
115,591
05/31/2014
1.36%
1
156,169
05/31/2014
1.48%
5
1,790,649
05/31/2014
1.50%
1
160,593
05/31/2014
1.68%
1
370,945
05/31/2014
2.22%
3
1,240,044
05/31/2014
3.16%
2
2,477,720
05/31/2014
3.23%
12
13,255,183
05/31/2014
3.23%
12
13,255,183
05/31/2014
3.34%
1
108,689
05/31/2014
3.38%
3
1,319,349
05/31/2014
6.34%
1
8,061,013
05/31/2014
8.64%
1
191,446
06/30/2014
-9.00%
1
8,204,976
06/30/2014
-6.61%
1
8,274,374
06/30/2014
-0.98%
2
2,454,157
06/30/2014
-0.74%
12
13,150,894
06/30/2014
-0.74%
12
13,150,894
06/30/2014
0.09%
1
156,320
06/30/2014
0.20%
3
1,242,315
06/30/2014
0.22%
1
115,830
06/30/2014
0.67%
2
3,474,759
06/30/2014
0.94%
1
162,125
06/30/2014
1.17%
5
1,811,879
06/30/2014
1.22%
1
375,455
06/30/2014
3.19%
3
1,361,133
07/31/2014
-2.43%
3
1,316,087
07/31/2014
-1.94%
1
8,622,633
07/31/2014
-1.61%
3
3,341,853
07/31/2014
-1.57%
12
12,948,989
07/31/2014
-1.57%
12
12,948,989
07/31/2014
-1.56%
1
369,701
07/31/2014
-1.50%
1
785,873
07/31/2014
-1.42%
3
1,043,510
07/31/2014
-1.38%
5
1,787,488
07/31/2014
-1.19%
1
160,216
07/31/2014
-1.18%
2
3,433,340
07/31/2014
-0.35%
1
8,622,633
07/31/2014
-0.33%
1
115,452
07/31/2014
25.33%
1
369,701
08/31/2014
1.96%
4
888,665
08/31/2014
2.11%
1
117,904
08/31/2014
2.72%
2
1,962,967
08/31/2014
2.73%
2
630,527
08/31/2014
2.75%
13
14,002,448
08/31/2014
2.75%
13
14,002,448
08/31/2014
2.81%
1
807,974
08/31/2014
3.06%
1
381,070
08/31/2014
3.14%
1
165,238
08/31/2014
3.24%
5
1,844,506
08/31/2014
3.73%
1
107,585
08/31/2014
5.20%
3
1,384,257
09/30/2014
-3.57%
1
159,323
09/30/2014
-3.44%
6
2,211,260
09/30/2014
-3.19%
1
369,031
09/30/2014
-2.35%
3
1,351,937
09/30/2014
-2.30%
2
616,066
09/30/2014
-1.67%
1
794,439
09/30/2014
-1.65%
1
115,960
09/30/2014
-1.56%
2
1,932,082
09/30/2014
-0.97%
16
17,103,909
09/30/2014
-0.97%
16
17,103,909
09/30/2014
-0.75%
2
3,400,344
09/30/2014
3.72%
1
9,298,273
09/30/2014
8.66%
1
9,262,341
10/31/2014
-1.71%
1
9,362,403
10/31/2014
0.91%
3
1,351,092
10/31/2014
1.63%
1
117,850
10/31/2014
1.92%
3
738,776
10/31/2014
2.20%
2
1,974,234
10/31/2014
2.20%
1
811,896
10/31/2014
2.28%
16
17,467,978
10/31/2014
2.28%
16
17,467,978
10/31/2014
2.35%
2
3,481,137
10/31/2014
2.43%
1
10,008,906
10/31/2014
2.46%
1
378,102
10/31/2014
2.47%
6
2,265,609
10/31/2014
2.53%
1
163,334
11/30/2014
0.45%
1
164,039
11/30/2014
1.04%
7
2,792,514
11/30/2014
1.13%
1
119,191
11/30/2014
1.54%
1
383,941
11/30/2014
2.25%
3
755,537
11/30/2014
3.20%
1
837,803
11/30/2014
3.26%
2
2,038,162
11/30/2014
3.87%
18
20,256,425
11/30/2014
3.87%
18
20,256,425
11/30/2014
4.19%
3
1,407,928
11/30/2014
5.31%
1
116,101
11/30/2014
5.80%
1
10,904,211
11/30/2014
11.76%
6
1,372,922
12/31/2014
-0.68%
5
1,217,149
12/31/2014
-0.67%
1
12,030,016
12/31/2014
-0.47%
1
380,014
12/31/2014
-0.45%
3
1,379,171
12/31/2014
-0.43%
3
752,469
12/31/2014
-0.42%
2
2,029,363
12/31/2014
-0.39%
1
834,654
12/31/2014
-0.38%
18
20,150,000
12/31/2014
-0.38%
18
20,150,000
12/31/2014
0.18%
1
164,277
12/31/2014
0.32%
1
119,551
12/31/2014
1.85%
2
3,555,240
12/31/2014
3.06%
1
11,795,198
01/31/2015
-2.57%
6
1,378,303
01/31/2015
-0.98%
18
19,919,699
01/31/2015
-0.98%
18
19,919,699
01/31/2015
-0.75%
3
1,368,783
01/31/2015
-0.70%
2
1,939,405
01/31/2015
-0.25%
1
832,539
01/31/2015
0.11%
3
753,343
01/31/2015
0.31%
1
381,149
01/31/2015
0.75%
2
3,582,302
01/31/2015
0.96%
6
1,719,247
01/31/2015
1.18%
1
12,444,086
01/31/2015
1.58%
1
166,829
01/31/2015
2.88%
1
123,021
02/28/2015
-1.18%
1
121,555
02/28/2015
0.67%
1
167,933
02/28/2015
1.56%
6
2,099,558
02/28/2015
2.06%
1
15,657,291
02/28/2015
2.44%
1
390,363
02/28/2015
2.86%
3
774,912
02/28/2015
3.22%
1
859,343
02/28/2015
3.60%
2
3,711,622
02/28/2015
3.71%
2
2,084,019
02/28/2015
4.63%
18
20,958,438
02/28/2015
4.63%
18
20,958,438
02/28/2015
4.71%
3
1,433,425
02/28/2015
8.16%
1
15,657,291
03/31/2015
-0.68%
5
1,591,335
03/31/2015
-0.55%
3
770,599
03/31/2015
-0.53%
1
388,312
03/31/2015
-0.39%
3
1,428,426
03/31/2015
-0.11%
2
2,080,960
03/31/2015
-0.08%
18
21,051,339
03/31/2015
-0.08%
18
21,051,339
03/31/2015
0.08%
1
860,229
03/31/2015
0.27%
1
121,879
03/31/2015
0.97%
2
3,650,495
03/31/2015
1.44%
1
15,885,435
03/31/2015
3.53%
1
15,669,485
04/30/2015
-20.57%
1
14,352,101
04/30/2015
-6.31%
2
488,405
04/30/2015
-4.51%
18
21,070,106
04/30/2015
-4.51%
18
21,070,106
04/30/2015
-4.28%
2
3,493,831
04/30/2015
-3.33%
3
1,355,738
04/30/2015
-3.18%
1
832,788
04/30/2015
-2.89%
2
2,020,851
04/30/2015
-1.47%
3
759,480
04/30/2015
-0.56%
1
121,190
04/30/2015
-0.31%
1
387,049
04/30/2015
0.39%
6
2,109,493
04/30/2015
0.77%
1
15,223,766
05/31/2015
-0.38%
1
120,718
05/31/2015
-0.14%
6
2,097,728
05/31/2015
0.64%
1
389,562
05/31/2015
1.57%
3
770,935
05/31/2015
2.10%
2
2,063,891
05/31/2015
2.22%
1
851,306
05/31/2015
2.66%
3
1,391,891
05/31/2015
2.81%
1
118,780
05/31/2015
2.95%
19
23,374,830
05/31/2015
2.95%
19
23,374,830
05/31/2015
5.24%
2
514,034
05/31/2015
7.96%
1
16,299,277
05/31/2015
8.99%
8
2,118,877
06/30/2015
-2.77%
6
2,024,412
06/30/2015
-2.48%
2
501,173
06/30/2015
-2.23%
1
380,815
06/30/2015
-1.93%
4
932,870
06/30/2015
-1.82%
1
118,529
06/30/2015
-1.55%
2
3,418,426
06/30/2015
-1.45%
3
1,371,362
06/30/2015
-1.31%
1
840,054
06/30/2015
-1.27%
2
2,037,447
06/30/2015
-0.77%
19
23,172,243
06/30/2015
-0.77%
19
23,172,243
06/30/2015
5.20%
1
17,491,398
06/30/2015
5.89%
1
17,491,398
07/31/2015
0.69%
6
2,037,930
07/31/2015
1.27%
1
120,014
07/31/2015
1.63%
2
738,703
07/31/2015
2.47%
4
955,762
07/31/2015
2.65%
3
3,941,565
07/31/2015
3.03%
3
1,399,731
07/31/2015
3.10%
1
866,188
07/31/2015
3.69%
21
24,921,667
07/31/2015
3.69%
21
24,921,667
07/31/2015
5.65%
2
3,610,082
07/31/2015
7.39%
2
538,235
07/31/2015
11.65%
1
19,527,799
07/31/2015
27.10%
1
19,824,638
08/31/2015
-8.57%
1
19,110,605
08/31/2015
-5.64%
1
123,424
08/31/2015
-5.54%
3
1,319,755
08/31/2015
-4.52%
4
912,438
08/31/2015
-4.49%
2
514,011
08/31/2015
-4.45%
6
1,947,175
08/31/2015
-4.40%
2
706,348
08/31/2015
-4.21%
20
23,833,480
08/31/2015
-4.21%
20
23,833,480
08/31/2015
-3.71%
1
833,995
08/31/2015
-3.63%
3
3,798,768
08/31/2015
-1.95%
1
19,924,352
08/31/2015
-1.39%
1
118,334
09/30/2015
-2.23%
3
1,290,148
09/30/2015
-1.87%
5
1,172,939
09/30/2015
-0.43%
2
703,002
09/30/2015
-0.06%
4
911,763
09/30/2015
0.34%
1
118,737
09/30/2015
0.66%
3
3,823,587
09/30/2015
0.67%
1
839,554
09/30/2015
1.40%
19
23,255,065
09/30/2015
1.40%
19
23,255,065
09/30/2015
1.40%
2
3,392,121
09/30/2015
4.00%
2
522,617
09/30/2015
6.90%
1
21,692,748
09/30/2015
18.46%
1
21,792,591
10/31/2015
0.54%
1
243,743
10/31/2015
0.87%
1
119,759
10/31/2015
2.99%
4
939,168
10/31/2015
3.10%
3
3,941,481
10/31/2015
3.17%
1
866,182
10/31/2015
3.19%
21
25,555,163
10/31/2015
3.19%
21
25,555,163
10/31/2015
3.24%
2
726,161
10/31/2015
3.51%
2
3,509,729
10/31/2015
3.69%
5
1,216,315
10/31/2015
6.33%
3
1,358,002
10/31/2015
7.68%
1
23,227,039
10/31/2015
8.74%
10
3,400,920
11/30/2015
-1.66%
2
338,593
11/30/2015
-1.19%
2
717,465
11/30/2015
-1.15%
4
928,223
11/30/2015
-0.89%
21
25,401,577
11/30/2015
-0.89%
21
25,401,577
11/30/2015
-0.81%
5
1,215,703
11/30/2015
-0.79%
3
3,845,111
11/30/2015
-0.47%
1
862,216
11/30/2015
-0.42%
1
119,263
11/30/2015
-0.04%
2
3,507,623
11/30/2015
-0.02%
3
1,357,980
11/30/2015
0.51%
1
23,892,067
11/30/2015
2.85%
1
24,014,364
12/31/2015
-1.78%
5
1,722,400
12/31/2015
-1.63%
2
705,806
12/31/2015
-1.42%
4
914,478
12/31/2015
-1.07%
3
1,311,970
12/31/2015
-0.77%
3
3,795,557
12/31/2015
-0.69%
1
856,184
12/31/2015
-0.66%
1
118,476
12/31/2015
-0.64%
2
336,429
12/31/2015
-0.64%
22
26,273,643
12/31/2015
-0.64%
22
26,273,643
12/31/2015
-0.46%
2
3,368,143
12/31/2015
4.27%
1
25,241,852
12/31/2015
5.23%
1
24,493,849
01/31/2016
-9.02%
1
23,077,377
01/31/2016
-7.78%
12
3,873,622
01/31/2016
-6.07%
3
1,232,304
01/31/2016
-5.82%
2
316,874
01/31/2016
-4.70%
23
26,292,503
01/31/2016
-4.70%
23
26,292,503
01/31/2016
-3.89%
4
1,084,581
01/31/2016
-3.71%
4
5,078,321
01/31/2016
-3.52%
2
3,248,484
01/31/2016
-3.38%
2
2,331,506
01/31/2016
-3.37%
2
681,933
01/31/2016
-2.11%
6
2,066,187
01/31/2016
1.04%
1
119,720
02/29/2016
-1.87%
2
310,781
02/29/2016
-1.23%
3
1,217,030
02/29/2016
-0.29%
2
3,238,412
02/29/2016
-0.24%
4
1,081,766
02/29/2016
-0.02%
1
24,065,298
02/29/2016
0.02%
24
26,322,565
02/29/2016
0.02%
24
26,322,565
02/29/2016
0.04%
2
682,144
02/29/2016
0.17%
2
2,334,922
02/29/2016
0.18%
4
5,085,263
02/29/2016
0.58%
5
1,695,922
02/29/2016
0.76%
1
436,950
02/29/2016
1.03%
1
120,977
02/29/2016
2.12%
1
24,834,855
03/31/2016
1.51%
1
122,777
03/31/2016
3.83%
2
322,764
03/31/2016
4.45%
1
456,391
03/31/2016
4.94%
2
2,449,496
03/31/2016
5.14%
5
1,783,008
03/31/2016
5.19%
4
5,421,697
03/31/2016
5.26%
5
1,366,238
03/31/2016
5.28%
2
718,325
03/31/2016
5.33%
1
817,065
03/31/2016
5.48%
3
4,112,484
03/31/2016
5.80%
3
1,288,097
03/31/2016
5.92%
23
26,656,338
03/31/2016
5.92%
23
26,656,338
03/31/2016
6.07%
1
25,994,472
03/31/2016
12.59%
1
25,815,024
04/30/2016
-6.35%
1
25,515,986
04/30/2016
-4.71%
15
4,974,998
04/30/2016
-1.73%
2
305,097
04/30/2016
-0.75%
24
27,360,699
04/30/2016
-0.75%
24
27,360,699
04/30/2016
-0.58%
4
5,391,121
04/30/2016
-0.55%
2
2,436,101
04/30/2016
-0.45%
3
4,092,178
04/30/2016
-0.25%
3
1,260,038
04/30/2016
0.20%
1
123,025
04/30/2016
0.32%
1
819,518
04/30/2016
0.51%
6
1,680,723
04/30/2016
0.71%
2
723,374
04/30/2016
1.08%
1
476,245
04/30/2016
1.19%
5
1,977,115
05/31/2016
-0.49%
1
474,048
05/31/2016
-0.18%
1
122,820
05/31/2016
-0.08%
7
2,676,794
05/31/2016
0.11%
2
724,246
05/31/2016
0.17%
8
2,397,278
05/31/2016
0.56%
1
824,286
05/31/2016
0.86%
4
5,438,300
05/31/2016
1.05%
2
2,461,940
05/31/2016
1.36%
24
27,760,024
05/31/2016
1.36%
24
27,760,024
05/31/2016
1.53%
3
4,155,547
05/31/2016
1.68%
2
310,198
05/31/2016
1.76%
1
26,973,891
05/31/2016
1.83%
3
1,283,365
05/31/2016
4.11%
1
26,973,891
06/30/2016
2.39%
2
970,746
06/30/2016
2.39%
1
485,397
06/30/2016
2.42%
3
1,314,091
06/30/2016
2.46%
2
742,163
06/30/2016
2.49%
8
2,457,847
06/30/2016
2.49%
6
2,640,658
06/30/2016
2.57%
1
125,973
06/30/2016
2.62%
1
845,800
06/30/2016
2.92%
2
319,187
06/30/2016
3.81%
24
28,823,488
06/30/2016
3.81%
24
28,823,488
06/30/2016
3.81%
4
5,780,605
06/30/2016
4.11%
2
2,697,362
06/30/2016
6.15%
1
28,687,720
06/30/2016
6.15%
1
28,687,720
07/31/2016
-2.13%
1
28,463,136
07/31/2016
-1.92%
1
28,463,136
07/31/2016
-0.54%
2
317,485
07/31/2016
0.56%
25
31,841,375
07/31/2016
0.56%
25
31,841,375
07/31/2016
0.80%
2
2,719,484
07/31/2016
0.81%
4
5,824,960
07/31/2016
1.11%
1
127,367
07/31/2016
1.24%
1
856,332
07/31/2016
1.48%
8
2,519,687
07/31/2016
1.64%
2
754,469
07/31/2016
1.78%
3
4,253,072
07/31/2016
1.86%
1
494,455
07/31/2016
2.28%
8
3,514,562
07/31/2016
2.83%
3
1,338,728
08/31/2016
-5.96%
1
27,983,358
08/31/2016
-5.51%
1
248,402
08/31/2016
-4.51%
2
293,718
08/31/2016
-2.12%
25
31,274,792
08/31/2016
-2.12%
26
31,474,558
08/31/2016
-1.77%
3
4,177,607
08/31/2016
-1.65%
4
5,752,453
08/31/2016
-1.50%
2
2,702,583
08/31/2016
-1.38%
8
2,485,990
08/31/2016
-1.10%
3
1,323,860
08/31/2016
-1.00%
1
847,658
08/31/2016
-0.98%
2
747,218
08/31/2016
-0.53%
1
126,703
08/31/2016
-0.35%
1
492,750
08/31/2016
-0.07%
8
3,499,979
09/30/2016
-1.42%
1
29,318,063
09/30/2016
-0.15%
3
4,169,464
09/30/2016
-0.10%
1
126,550
09/30/2016
-0.09%
1
247,764
09/30/2016
-0.08%
27
32,661,734
09/30/2016
-0.07%
26
32,461,915
09/30/2016
-0.04%
3
4,206,957
09/30/2016
0.03%
5
7,259,779
09/30/2016
0.03%
8
3,501,346
09/30/2016
0.10%
1
848,357
09/30/2016
0.15%
2
748,109
09/30/2016
0.15%
2
294,109
09/30/2016
0.16%
8
2,489,133
09/30/2016
0.37%
1
494,443
09/30/2016
0.87%
3
1,335,155
10/31/2016
-2.72%
2
494,504
10/31/2016
-2.21%
8
3,408,048
10/31/2016
-2.16%
3
3,980,257
10/31/2016
-2.08%
28
32,518,816
10/31/2016
-2.02%
26
31,849,694
10/31/2016
-1.94%
1
484,846
10/31/2016
-1.93%
3
4,127,140
10/31/2016
-1.90%
6
10,549,175
10/31/2016
-1.66%
1
834,402
10/31/2016
-1.66%
3
1,030,382
10/31/2016
-1.61%
8
2,449,781
10/31/2016
-1.54%
1
124,569
10/31/2016
-0.75%
1
29,822,176
10/31/2016
-0.26%
2
283,198
10/31/2016
0.62%
1
29,822,176
11/30/2016
-3.32%
1
171,433
11/30/2016
-2.29%
1
121,676
11/30/2016
-2.16%
2
1,015,662
11/30/2016
-1.64%
2
349,896
11/30/2016
-1.17%
3
3,932,947
11/30/2016
-0.83%
1
480,938
11/30/2016
-0.73%
1
828,196
11/30/2016
-0.48%
8
2,437,186
11/30/2016
-0.27%
28
32,557,024
11/30/2016
-0.25%
6
10,523,280
11/30/2016
-0.21%
3
1,027,846
11/30/2016
-0.16%
26
31,885,107
11/30/2016
-0.07%
3
4,124,883
11/30/2016
0.31%
1
29,904,021
11/30/2016
0.71%
9
3,927,225
12/31/2016
-0.17%
1
31,059,060
12/31/2016
0.42%
1
122,204
12/31/2016
0.85%
1
172,913
12/31/2016
0.90%
28
32,836,347
12/31/2016
0.94%
26
32,155,912
12/31/2016
0.95%
3
3,969,060
12/31/2016
1.04%
1
836,576
12/31/2016
1.09%
3
4,169,848
12/31/2016
1.09%
6
10,638,687
12/31/2016
1.12%
1
486,301
12/31/2016
1.19%
3
1,243,054
12/31/2016
1.45%
8
2,473,248
12/31/2016
1.47%
3
1,043,335
12/31/2016
1.52%
9
3,988,547
12/31/2016
1.69%
1
31,059,060
01/31/2017
0.65%
1
123,012
01/31/2017
1.39%
9
3,935,486
01/31/2017
1.46%
1
493,354
01/31/2017
1.68%
3
1,060,743
01/31/2017
1.70%
8
2,518,905
01/31/2017
1.79%
1
175,997
01/31/2017
2.30%
3
4,265,149
01/31/2017
2.49%
3
3,985,754
01/31/2017
2.57%
6
10,833,956
01/31/2017
3.02%
29
33,967,071
01/31/2017
3.05%
26
33,163,753
01/31/2017
3.10%
1
862,586
01/31/2017
3.86%
3
1,290,875
01/31/2017
5.94%
1
32,904,794
01/31/2017
5.94%
1
32,904,794
02/28/2017
1.08%
1
124,329
02/28/2017
1.57%
1
178,738
02/28/2017
1.66%
1
501,586
02/28/2017
1.95%
9
2,723,875
02/28/2017
2.02%
3
1,082,104
02/28/2017
2.15%
3
1,318,400
02/28/2017
2.15%
9
4,017,373
02/28/2017
2.36%
3
4,365,997
02/28/2017
2.44%
6
11,092,563
02/28/2017
2.60%
3
4,090,121
02/28/2017
2.73%
29
34,809,154
02/28/2017
2.76%
26
33,984,111
02/28/2017
2.79%
1
886,577
02/28/2017
3.59%
1
34,085,223
02/28/2017
3.59%
1
34,085,223
03/31/2017
-0.15%
9
3,996,349
03/31/2017
-0.05%
1
124,269
03/31/2017
0.09%
1
502,165
03/31/2017
0.25%
1
1,002,637
03/31/2017
0.41%
3
1,086,217
03/31/2017
0.47%
9
2,737,464
03/31/2017
0.86%
3
4,403,231
03/31/2017
0.89%
6
11,185,181
03/31/2017
1.01%
1
895,647
03/31/2017
1.25%
3
4,141,246
03/31/2017
1.41%
29
35,469,732
03/31/2017
1.43%
26
34,635,992
03/31/2017
2.15%
3
1,346,577
03/31/2017
4.09%
1
35,474,863
03/31/2017
4.09%
1
35,474,863
03/31/2017
521.22%
1
35,474,863
04/30/2017
-0.62%
1
35,482,959
04/30/2017
-0.62%
1
35,482,959
04/30/2017
0.15%
2
496,887
04/30/2017
0.29%
27
35,181,276
04/30/2017
0.34%
31
37,521,472
04/30/2017
0.42%
1
1,006,883
04/30/2017
0.47%
3
4,422,278
04/30/2017
0.52%
9
2,764,693
04/30/2017
0.56%
3
1,092,384
04/30/2017
0.68%
6
11,238,968
04/30/2017
0.73%
1
902,143
04/30/2017
0.87%
1
125,351
04/30/2017
0.93%
9
4,016,468
04/30/2017
0.98%
1
520,114
04/30/2017
0.98%
3
4,100,953
04/30/2017
508.09%
1
35,482,959
05/31/2017
0.43%
10
4,250,683
05/31/2017
0.59%
1
523,215
05/31/2017
0.64%
1
126,168
05/31/2017
1.28%
4
1,278,599
05/31/2017
1.59%
8
2,683,483
05/31/2017
1.63%
1
1,023,440
05/31/2017
2.51%
1
1,027,173
05/31/2017
2.65%
1
870,457
05/31/2017
2.79%
7
12,322,433
05/31/2017
2.87%
3
4,546,034
05/31/2017
3.40%
2
513,911
05/31/2017
3.52%
3
4,349,636
05/31/2017
4.10%
31
39,050,390
05/31/2017
4.19%
27
36,630,001
05/31/2017
10.70%
1
39,312,419
05/31/2017
10.70%
1
39,312,419
06/30/2017
-7.55%
1
36,811,611
06/30/2017
-7.55%
1
36,811,611
06/30/2017
-2.57%
32
38,570,011
06/30/2017
-2.48%
27
35,730,450
06/30/2017
-2.10%
2
503,166
06/30/2017
-1.91%
1
120,629
06/30/2017
-1.42%
3
4,288,353
06/30/2017
-1.40%
3
4,483,447
06/30/2017
-1.37%
7
12,148,430
06/30/2017
-1.20%
1
852,841
06/30/2017
-0.90%
1
1,014,296
06/30/2017
-0.85%
1
1,018,416
06/30/2017
-0.27%
8
2,675,080
06/30/2017
-0.15%
4
1,276,625
06/30/2017
0.18%
1
126,367
06/30/2017
0.31%
1
524,917
06/30/2017
0.61%
10
5,153,615
07/31/2017
0.68%
1
127,253
07/31/2017
1.75%
1
534,118
07/31/2017
1.78%
10
5,232,983
07/31/2017
1.99%
1
1,034,411
07/31/2017
2.28%
4
1,305,672
07/31/2017
2.36%
9
2,840,241
07/31/2017
2.53%
3
4,396,828
07/31/2017
2.98%
1
878,180
07/31/2017
3.00%
1
1,049,149
07/31/2017
3.15%
7
12,633,676
07/31/2017
3.19%
3
4,725,161
07/31/2017
3.65%
1
125,030
07/31/2017
3.66%
3
1,533,561
07/31/2017
4.07%
33
41,010,004
07/31/2017
4.19%
27
37,038,388
07/31/2017
7.96%
1
39,901,207
07/31/2017
7.96%
1
39,901,207
08/31/2017
-0.08%
3
1,532,503
08/31/2017
0.69%
10
5,269,727
08/31/2017
0.89%
1
538,844
08/31/2017
1.13%
1
128,705
08/31/2017
1.30%
4
1,329,920
08/31/2017
1.54%
2
1,142,473
08/31/2017
1.54%
1
1,050,478
08/31/2017
1.57%
1
888,506
08/31/2017
1.62%
9
2,883,644
08/31/2017
1.87%
3
4,814,553
08/31/2017
1.97%
1
1,070,142
08/31/2017
2.03%
7
12,884,105
08/31/2017
2.61%
34
43,949,083
08/31/2017
2.64%
3
4,431,052
08/31/2017
2.82%
27
38,864,042
08/31/2017
6.86%
1
43,968,943
08/31/2017
6.86%
1
43,968,943
09/30/2017
-1.02%
1
44,029,476
09/30/2017
-1.02%
1
44,029,476
09/30/2017
-0.51%
1
128,052
09/30/2017
-0.13%
1
1,048,967
09/30/2017
0.13%
1
886,134
09/30/2017
0.17%
3
4,439,382
09/30/2017
0.31%
1
1,073,610
09/30/2017
0.39%
1
540,964
09/30/2017
0.41%
7
12,937,395
09/30/2017
0.42%
2
1,147,274
09/30/2017
0.49%
35
46,273,407
09/30/2017
0.55%
3
4,840,077
09/30/2017
0.58%
28
41,109,974
09/30/2017
0.76%
9
2,913,518
09/30/2017
0.80%
5
1,836,151
09/30/2017
0.90%
10
5,314,937
09/30/2017
3.40%
3
1,583,895
10/31/2017
0.19%
1
128,278
10/31/2017
0.78%
1
545,033
10/31/2017
0.91%
10
5,350,984
10/31/2017
1.62%
5
1,853,704
10/31/2017
1.88%
1
1,068,698
10/31/2017
2.08%
9
2,975,355
10/31/2017
2.21%
3
4,946,967
10/31/2017
2.42%
7
13,245,894
10/31/2017
2.58%
1
905,307
10/31/2017
2.95%
1
1,105,246
10/31/2017
3.19%
28
42,671,314
10/31/2017
3.25%
35
48,037,515
10/31/2017
3.66%
2
1,189,050
10/31/2017
4.00%
3
4,618,773
10/31/2017
4.08%
3
1,648,136
10/31/2017
11.32%
1
49,396,552
10/31/2017
11.32%
1
49,396,552
11/30/2017
-0.85%
3
1,633,971
11/30/2017
0.41%
1
128,796
11/30/2017
0.67%
1
51,205,370
11/30/2017
0.67%
1
51,205,370
11/30/2017
0.71%
1
1,076,222
11/30/2017
0.92%
1
910,274
11/30/2017
1.02%
1
550,508
11/30/2017
1.13%
7
13,352,310
11/30/2017
1.14%
1
1,117,740
11/30/2017
1.20%
2
1,203,224
11/30/2017
1.21%
3
4,960,149
11/30/2017
1.23%
29
44,073,706
11/30/2017
1.25%
37
49,661,147
11/30/2017
1.33%
10
3,132,293
11/30/2017
1.35%
5
1,875,889
11/30/2017
1.51%
3
4,606,269
11/30/2017
1.52%
10
5,476,784
12/31/2017
-3.48%
1
51,503,174
12/31/2017
-3.48%
1
51,503,174
12/31/2017
-0.31%
3
1,439,293
12/31/2017
-0.24%
3
1,599,803
12/31/2017
0.04%
29
44,150,333
12/31/2017
0.07%
1
907,474
12/31/2017
0.07%
3
4,608,433
12/31/2017
0.10%
38
49,960,432
12/31/2017
0.12%
1
1,077,513
12/31/2017
0.27%
7
13,388,463
12/31/2017
0.32%
3
4,975,102
12/31/2017
0.48%
1
1,123,332
12/31/2017
0.63%
1
129,637
12/31/2017
0.64%
10
3,152,928
12/31/2017
0.86%
5
1,892,126
12/31/2017
1.06%
10
5,538,811
12/31/2017
1.06%
1
556,348
01/31/2018
-0.12%
1
129,490
01/31/2018
2.02%
1
567,540
01/31/2018
2.55%
10
5,557,321
01/31/2018
3.37%
5
1,948,317
01/31/2018
3.50%
1
1,115,354
01/31/2018
3.99%
3
5,172,834
01/31/2018
3.99%
11
3,390,237
01/31/2018
4.41%
7
13,877,217
01/31/2018
4.91%
1
948,260
01/31/2018
5.38%
1
1,183,754
01/31/2018
6.22%
29
46,837,248
01/31/2018
6.42%
38
54,074,394
01/31/2018
6.51%
2
4,751,879
01/31/2018
6.72%
4
1,810,994
01/31/2018
6.76%
3
2,558,823
01/31/2018
17.18%
1
60,981,580
01/31/2018
17.18%
1
60,981,580
02/28/2018
-8.56%
1
56,132,857
02/28/2018
-8.56%
1
56,132,857
02/28/2018
-5.58%
2
4,329,766
02/28/2018
-5.32%
3
2,423,174
02/28/2018
-4.60%
1
901,393
02/28/2018
-4.45%
38
52,595,638
02/28/2018
-4.18%
29
44,908,704
02/28/2018
-3.93%
11
3,287,692
02/28/2018
-3.82%
5
1,873,413
02/28/2018
-3.77%
1
1,139,248
02/28/2018
-3.66%
7
13,600,350
02/28/2018
-3.53%
10
5,383,407
02/28/2018
-3.40%
3
5,223,432
02/28/2018
-3.11%
1
549,827
02/28/2018
-1.87%
1
177,007
02/28/2018
-1.73%
4
1,779,179
03/31/2018
-4.52%
1
54,393,293
03/31/2018
-4.52%
1
54,393,293
03/31/2018
-1.77%
2
4,252,089
03/31/2018
-1.35%
4
1,756,272
03/31/2018
-1.14%
3
2,626,723
03/31/2018
-1.08%
29
45,316,016
03/31/2018
-0.98%
1
1,128,412
03/31/2018
-0.93%
38
53,132,253
03/31/2018
-0.70%
1
891,643
03/31/2018
-0.60%
11
3,254,231
03/31/2018
-0.49%
7
13,102,231
03/31/2018
-0.45%
3
5,473,791
03/31/2018
-0.31%
5
1,787,801
03/31/2018
0.23%
10
5,465,584
03/31/2018
0.38%
1
551,879
03/31/2018
0.72%
1
178,278
04/30/2018
-4.12%
1
54,236,979
04/30/2018
-4.12%
1
54,236,979
04/30/2018
-1.91%
3
2,576,560
04/30/2018
-1.76%
38
52,014,899
04/30/2018
-1.74%
29
44,338,589
04/30/2018
-1.61%
1
835,870
04/30/2018
-1.61%
7
12,674,637
04/30/2018
-1.49%
2
4,187,502
04/30/2018
-1.42%
1
1,112,427
04/30/2018
-1.38%
3
5,397,775
04/30/2018
-0.90%
1
176,714
04/30/2018
-0.88%
11
3,229,770
04/30/2018
-0.87%
5
1,767,767
04/30/2018
-0.87%
3
1,608,801
04/30/2018
-0.50%
1
562,115
04/30/2018
-0.44%
10
5,485,300
05/31/2018
0.87%
1
178,262
05/31/2018
0.93%
1
567,426
05/31/2018
1.04%
1
840,942
05/31/2018
1.19%
1
1,226,940
05/31/2018
1.20%
10
3,097,398
05/31/2018
1.25%
5
1,789,426
05/31/2018
1.34%
10
5,547,693
05/31/2018
1.38%
4
2,770,886
05/31/2018
1.50%
29
45,180,287
05/31/2018
1.51%
39
53,127,221
05/31/2018
1.53%
3
5,479,820
05/31/2018
1.58%
7
13,035,709
05/31/2018
2.10%
2
4,378,887
05/31/2018
2.50%
1
65,904,345
05/31/2018
2.50%
1
65,904,345
05/31/2018
5.70%
4
1,804,767
06/30/2018
-5.41%
1
61,747,221
06/30/2018
-5.41%
1
61,747,221
06/30/2018
-2.37%
30
44,491,324
06/30/2018
-2.36%
41
52,434,906
06/30/2018
-1.92%
1
1,203,535
06/30/2018
-1.79%
7
12,796,455
06/30/2018
-1.68%
5
2,868,374
06/30/2018
-1.60%
3
5,392,887
06/30/2018
-1.58%
2
4,113,473
06/30/2018
-1.57%
4
1,776,467
06/30/2018
-1.39%
1
829,240
06/30/2018
-0.82%
10
3,077,775
06/30/2018
-0.62%
5
1,778,027
06/30/2018
-0.35%
1
565,366
06/30/2018
-0.21%
10
5,460,981
06/30/2018
0.01%
1
178,271
07/31/2018
0.27%
1
178,732
07/31/2018
0.68%
1
753,086
07/31/2018
1.14%
1
571,776
07/31/2018
1.38%
1
837,065
07/31/2018
1.40%
3
5,470,490
07/31/2018
1.50%
10
5,532,968
07/31/2018
1.53%
41
53,263,451
07/31/2018
1.54%
7
12,838,945
07/31/2018
1.57%
4
1,273,085
07/31/2018
1.63%
5
2,915,126
07/31/2018
1.67%
30
45,185,805
07/31/2018
1.70%
1
61,954,439
07/31/2018
1.70%
1
61,954,439
07/31/2018
1.76%
1
1,224,483
07/31/2018
1.76%
7
1,122,253
07/31/2018
1.85%
4
1,793,009
07/31/2018
1.93%
2
4,191,905
08/31/2018
0.36%
1
179,341
08/31/2018
0.78%
1
606,050
08/31/2018
1.01%
1
760,588
08/31/2018
1.25%
4
1,289,638
08/31/2018
1.31%
1
840,975
08/31/2018
1.33%
7
1,138,364
08/31/2018
1.37%
11
5,717,193
08/31/2018
1.85%
7
4,640,572
08/31/2018
1.97%
1
1,248,364
08/31/2018
2.24%
3
5,592,247
08/31/2018
2.28%
43
56,244,631
08/31/2018
2.28%
8
13,661,898
08/31/2018
2.53%
30
46,330,712
08/31/2018
2.74%
2
4,224,403
08/31/2018
4.87%
1
65,283,380
08/31/2018
4.87%
1
65,283,380
08/31/2018
4.92%
4
1,881,355
09/30/2018
-0.88%
1
177,759
09/30/2018
-0.80%
1
601,270
09/30/2018
-0.77%
11
5,675,195
09/30/2018
-0.32%
4
1,285,448
09/30/2018
-0.18%
1
759,292
09/30/2018
-0.10%
7
1,137,029
09/30/2018
-0.03%
2
4,224,684
09/30/2018
0.08%
1
841,531
09/30/2018
0.18%
3
5,602,090
09/30/2018
0.27%
7
12,132,632
09/30/2018
0.29%
7
4,654,240
09/30/2018
0.51%
45
57,700,656
09/30/2018
0.62%
1
1,255,971
09/30/2018
0.67%
30
46,668,011
09/30/2018
1.25%
4
1,905,139
09/30/2018
2.52%
1
66,924,120
09/30/2018
2.52%
1
66,924,120
10/31/2018
-10.13%
4
1,697,877
10/31/2018
-4.82%
2
4,019,539
10/31/2018
-4.81%
7
4,432,527
10/31/2018
-4.72%
11
5,398,179
10/31/2018
-4.59%
44
54,061,114
10/31/2018
-4.57%
1
1,198,534
10/31/2018
-4.56%
30
43,901,024
10/31/2018
-4.39%
1
64,081,862
10/31/2018
-4.39%
1
64,081,862
10/31/2018
-4.38%
6
10,224,934
10/31/2018
-4.19%
2
4,000,574
10/31/2018
-3.89%
1
801,940
10/31/2018
-3.82%
1
578,316
10/31/2018
-3.79%
4
1,237,018
10/31/2018
-3.69%
8
1,268,223
10/31/2018
-2.75%
1
738,304
10/31/2018
-1.63%
1
174,847
11/30/2018
-2.12%
2
63,126,759
11/30/2018
-2.12%
2
63,126,759
11/30/2018
0.17%
30
44,829,169
11/30/2018
0.18%
44
55,027,118
11/30/2018
0.25%
1
740,225
11/30/2018
0.30%
7
4,448,176
11/30/2018
0.52%
2
4,040,125
11/30/2018
0.69%
1
1,206,569
11/30/2018
0.71%
1
804,067
11/30/2018
0.73%
2
3,959,213
11/30/2018
0.74%
6
10,171,659
11/30/2018
0.93%
1
176,504
11/30/2018
1.14%
8
1,298,094
11/30/2018
1.26%
4
1,719,347
11/30/2018
1.36%
4
1,253,505
11/30/2018
1.46%
1
586,813
11/30/2018
1.63%
11
5,443,985
12/31/2018
-11.79%
2
55,320,119
12/31/2018
-11.79%
2
55,320,119
12/31/2018
-8.05%
2
1,216,448
12/31/2018
-7.67%
42
48,568,213
12/31/2018
-7.66%
30
41,325,620
12/31/2018
-7.00%
2
3,757,514
12/31/2018
-6.95%
7
4,137,593
12/31/2018
-6.28%
6
9,403,309
12/31/2018
-6.27%
1
1,130,984
12/31/2018
-5.79%
2
3,730,994
12/31/2018
-5.19%
1
762,469
12/31/2018
-5.09%
7
1,041,521
12/31/2018
-4.70%
4
1,209,615
12/31/2018
-4.33%
11
5,210,283
12/31/2018
-2.75%
1
720,051
12/31/2018
-2.74%
1
570,794
12/31/2018
0.48%
1
177,351
01/31/2019
1.64%
2
56,201,284
01/31/2019
1.64%
2
56,201,284
01/31/2019
1.94%
1
180,758
01/31/2019
2.69%
1
739,459
01/31/2019
4.15%
2
3,828,327
01/31/2019
4.19%
1
790,748
01/31/2019
4.21%
45
53,268,156
01/31/2019
4.42%
32
45,243,494
01/31/2019
4.58%
3
5,250,178
01/31/2019
4.69%
1
1,183,977
01/31/2019
4.76%
7
1,091,699
01/31/2019
4.76%
7
4,334,018
01/31/2019
4.76%
7
11,084,699
01/31/2019
4.78%
1
598,179
01/31/2019
4.96%
4
1,264,425
01/31/2019
5.80%
11
5,527,903
01/31/2019
6.23%
2
1,292,651
02/28/2019
0.00%
1
180,691
02/28/2019
0.61%
1
744,061
02/28/2019
0.90%
1
616,464
02/28/2019
1.09%
1
795,858
02/28/2019
1.27%
12
6,087,380
02/28/2019
1.30%
4
1,269,892
02/28/2019
1.31%
1
1,199,815
02/28/2019
1.37%
7
1,107,201
02/28/2019
1.45%
7
11,274,135
02/28/2019
1.47%
3
5,353,374
02/28/2019
1.60%
9
5,626,422
02/28/2019
1.66%
47
55,546,675
02/28/2019
1.71%
32
45,971,593
02/28/2019
2.15%
2
3,910,172
02/28/2019
2.76%
2
57,480,958
02/28/2019
2.76%
2
57,480,958
02/28/2019
4.10%
3
1,448,664
03/31/2019
1.20%
13
6,222,627
03/31/2019
1.22%
3
1,465,958
03/31/2019
1.25%
4
1,285,775
03/31/2019
1.36%
7
1,020,830
03/31/2019
1.38%
1
803,432
03/31/2019
1.44%
1
625,249
03/31/2019
1.56%
10
7,616,276
03/31/2019
1.59%
1
183,516
03/31/2019
1.85%
3
5,449,299
03/31/2019
1.94%
7
11,440,359
03/31/2019
2.00%
49
61,523,536
03/31/2019
2.09%
1
1,225,058
03/31/2019
2.10%
32
47,286,538
03/31/2019
2.22%
2
3,997,297
03/31/2019
3.81%
2
59,557,415
03/31/2019
3.81%
2
59,557,415
04/30/2019
0.24%
1
183,973
04/30/2019
0.27%
2
58,697,111
04/30/2019
0.27%
2
58,697,111
04/30/2019
1.39%
50
62,319,726
04/30/2019
1.42%
33
47,862,277
04/30/2019
1.43%
1
811,388
04/30/2019
1.51%
3
1,487,536
04/30/2019
1.54%
3
5,532,906
04/30/2019
1.56%
1
638,045
04/30/2019
1.58%
7
11,601,934
04/30/2019
1.65%
10
7,740,960
04/30/2019
1.81%
2
3,968,083
04/30/2019
1.89%
1
1,248,247
04/30/2019
1.89%
3
949,783
04/30/2019
2.03%
13
6,338,099
04/30/2019
2.05%
7
1,040,850
05/31/2019
-3.68%
3
1,404,026
05/31/2019
-3.01%
13
6,696,446
05/31/2019
-2.80%
3
923,327
05/31/2019
-2.43%
7
1,015,700
05/31/2019
-2.10%
1
634,544
05/31/2019
-1.11%
1
1,234,475
05/31/2019
-0.95%
10
7,665,621
05/31/2019
-0.79%
3
5,617,535
05/31/2019
-0.69%
2
3,942,374
05/31/2019
-0.62%
7
9,359,191
05/31/2019
-0.37%
50
62,061,702
05/31/2019
-0.31%
2
1,302,011
05/31/2019
-0.18%
33
47,706,340
05/31/2019
1.00%
1
185,827
05/31/2019
5.60%
2
61,991,759
05/31/2019
5.60%
2
61,991,759
06/30/2019
1.55%
1
188,675
06/30/2019
2.16%
2
63,050,697
06/30/2019
2.16%
2
63,050,697
06/30/2019
3.08%
2
1,548,625
06/30/2019
3.36%
7
9,882,430
06/30/2019
3.38%
2
4,075,351
06/30/2019
3.41%
50
63,621,049
06/30/2019
3.47%
3
5,811,338
06/30/2019
3.52%
11
8,660,377
06/30/2019
3.63%
32
48,054,608
06/30/2019
3.74%
1
658,274
06/30/2019
3.89%
7
1,055,140
06/30/2019
3.92%
1
1,282,579
06/30/2019
4.01%
3
960,532
06/30/2019
4.21%
15
7,197,586
06/30/2019
6.20%
3
1,491,056
07/31/2019
-0.14%
1
657,175
07/31/2019
0.01%
15
7,182,968
07/31/2019
0.05%
3
958,447
07/31/2019
0.06%
1
188,753
07/31/2019
0.16%
2
1,699,609
07/31/2019
0.20%
7
1,021,213
07/31/2019
0.32%
2
398,304
07/31/2019
0.40%
1
1,287,654
07/31/2019
0.43%
7
10,073,410
07/31/2019
0.43%
3
5,839,492
07/31/2019
0.46%
11
8,703,346
07/31/2019
0.66%
50
64,462,712
07/31/2019
0.92%
2
4,032,103
07/31/2019
0.95%
32
49,124,496
07/31/2019
2.37%
2
65,298,120
07/31/2019
2.37%
2
65,298,120
08/31/2019
0.24%
17
7,781,060
08/31/2019
0.65%
1
661,398
08/31/2019
1.10%
2
403,222
08/31/2019
1.19%
3
969,996
08/31/2019
1.71%
7
1,033,696
08/31/2019
2.20%
3
5,967,908
08/31/2019
2.27%
1
1,236,850
08/31/2019
2.36%
6
8,322,137
08/31/2019
2.81%
1
194,087
08/31/2019
2.85%
2
1,744,536
08/31/2019
3.34%
32
50,602,688
08/31/2019
3.54%
52
68,335,254
08/31/2019
3.95%
12
9,186,588
08/31/2019
4.25%
2
4,121,469
08/31/2019
12.60%
2
75,185,098
08/31/2019
12.60%
2
75,185,098
09/30/2019
-10.83%
2
67,155,975
09/30/2019
-10.83%
2
67,155,975
09/30/2019
-3.38%
12
8,880,472
09/30/2019
-3.05%
55
72,513,707
09/30/2019
-2.99%
2
3,915,520
09/30/2019
-2.75%
2
3,110,428
09/30/2019
-2.56%
35
55,344,694
09/30/2019
-1.92%
6
9,529,596
09/30/2019
-1.77%
1
1,214,847
09/30/2019
-1.61%
1
289,351
09/30/2019
-1.36%
3
5,821,560
09/30/2019
-0.89%
6
881,488
09/30/2019
-0.79%
1
192,552
09/30/2019
-0.56%
3
959,592
09/30/2019
0.41%
1
663,985
09/30/2019
0.58%
16
7,435,192
10/31/2019
0.62%
1
193,729
10/31/2019
1.25%
2
1,373,800
10/31/2019
1.56%
3
5,913,394
10/31/2019
1.57%
6
9,679,407
10/31/2019
1.58%
2
3,977,720
10/31/2019
1.58%
1
674,414
10/31/2019
1.64%
2
3,157,172
10/31/2019
1.66%
15
7,458,693
10/31/2019
1.69%
35
56,260,562
10/31/2019
1.73%
56
73,948,899
10/31/2019
1.77%
2
70,061,517
10/31/2019
1.77%
2
70,061,517
10/31/2019
1.82%
3
971,044
10/31/2019
1.89%
13
9,254,153
10/31/2019
1.91%
6
878,010
10/31/2019
1.95%
1
1,238,613
11/30/2019
-3.70%
2
69,019,828
11/30/2019
-3.70%
2
69,019,828
11/30/2019
-0.91%
13
9,279,005
11/30/2019
-0.79%
56
72,887,911
11/30/2019
-0.64%
35
55,746,258
11/30/2019
-0.52%
3
3,401,615
11/30/2019
-0.32%
1
193,126
11/30/2019
-0.31%
2
3,964,794
11/30/2019
-0.30%
6
9,304,734
11/30/2019
-0.28%
1
1,235,145
11/30/2019
-0.19%
3
5,903,119
11/30/2019
0.39%
6
881,067
11/30/2019
0.43%
3
965,610
11/30/2019
0.58%
1
688,252
11/30/2019
1.09%
16
7,631,456
11/30/2019
2.64%
2
1,410,216
12/31/2019
-0.05%
2
70,193,767
12/31/2019
-0.05%
2
70,193,767
12/31/2019
0.86%
2
3,999,742
12/31/2019
1.19%
3
5,974,722
12/31/2019
1.24%
58
75,044,534
12/31/2019
1.28%
6
9,420,526
12/31/2019
1.37%
37
57,391,238
12/31/2019
1.46%
3
3,445,804
12/31/2019
1.52%
2
1,404,390
12/31/2019
1.54%
13
9,701,372
12/31/2019
1.61%
2
1,017,289
12/31/2019
1.70%
1
1,255,867
12/31/2019
1.74%
17
8,333,028
12/31/2019
1.79%
3
982,850
12/31/2019
1.79%
6
896,736
12/31/2019
111.04%
2
1,017,289
01/31/2020
-0.21%
17
8,264,568
01/31/2020
-0.17%
3
976,282
01/31/2020
-0.14%
6
895,523
01/31/2020
-0.04%
1
267,532
01/31/2020
0.37%
1
1,260,402
01/31/2020
0.39%
3
3,454,615
01/31/2020
0.41%
6
9,455,815
01/31/2020
0.45%
60
80,438,741
01/31/2020
0.45%
3
6,001,200
01/31/2020
0.49%
38
59,310,065
01/31/2020
0.50%
13
9,748,349
01/31/2020
0.92%
2
1,417,299
01/31/2020
1.51%
2
3,976,839
01/31/2020
4.17%
2
71,995,859
01/31/2020
4.17%
2
71,995,859
01/31/2020
110.88%
1
267,532
02/29/2020
-12.09%
2
63,624,587
02/29/2020
-12.09%
2
63,624,587
02/29/2020
-7.80%
2
1,306,545
02/29/2020
-7.77%
2
3,666,981
02/29/2020
-7.41%
37
51,547,719
02/29/2020
-7.25%
59
71,392,760
02/29/2020
-7.10%
13
9,148,680
02/29/2020
-6.22%
1
1,182,015
02/29/2020
-5.54%
5
746,452
02/29/2020
-5.33%
3
921,285
02/29/2020
-5.22%
3
5,686,460
02/29/2020
-4.98%
7
9,693,207
02/29/2020
-4.64%
4
4,006,747
02/29/2020
-4.09%
16
6,416,343
02/29/2020
-2.81%
1
260,014
03/31/2020
-11.11%
2
1,145,116
03/31/2020
-9.63%
13
5,364,802
03/31/2020
-9.02%
3
835,956
03/31/2020
-8.75%
5
682,434
03/31/2020
-8.24%
2
2,659,130
03/31/2020
-7.66%
12
7,118,685
03/31/2020
-7.18%
1
241,350
03/31/2020
-6.50%
4
3,764,757
03/31/2020
-6.34%
56
58,486,722
03/31/2020
-6.09%
7
9,105,853
03/31/2020
-6.06%
37
46,826,836
03/31/2020
-5.81%
3
5,341,096
03/31/2020
-4.19%
3
4,012,405
03/31/2020
-0.36%
1
126,117
03/31/2020
-0.36%
1
126,117
03/31/2020
3.59%
2
1,623,835
03/31/2020
3.72%
2
64,395,429
03/31/2020
3.72%
2
64,395,429
03/31/2020
7.95%
4
3,026,421
04/30/2020
1.91%
2
65,771,826
04/30/2020
1.91%
2
65,771,826
04/30/2020
2.69%
2
6,531,698
04/30/2020
2.69%
2
6,531,698
04/30/2020
2.84%
1
129,714
04/30/2020
2.84%
1
129,714
04/30/2020
3.12%
5
6,392,409
04/30/2020
3.79%
8
11,977,766
04/30/2020
4.29%
3
3,751,318
04/30/2020
4.29%
3
3,751,318
04/30/2020
4.53%
38
52,540,093
04/30/2020
4.57%
3
5,585,356
04/30/2020
4.71%
58
66,553,665
04/30/2020
4.88%
1
253,071
04/30/2020
4.95%
1
2,646,436
04/30/2020
4.95%
1
2,646,436
04/30/2020
5.01%
13
8,913,525
04/30/2020
5.22%
5
718,065
04/30/2020
5.67%
3
883,450
04/30/2020
6.10%
13
5,689,997
04/30/2020
12.86%
2
1,290,152
05/31/2020
1.46%
1
131,590
05/31/2020
1.46%
1
131,590
05/31/2020
2.35%
5
6,538,886
05/31/2020
2.77%
8
12,297,450
05/31/2020
2.94%
1
260,481
05/31/2020
3.08%
3
5,758,564
05/31/2020
3.16%
5
740,893
05/31/2020
3.20%
58
68,031,132
05/31/2020
3.25%
16
6,517,200
05/31/2020
3.29%
3
912,563
05/31/2020
3.50%
14
10,050,087
05/31/2020
3.55%
38
54,308,585
05/31/2020
3.80%
3
3,946,507
05/31/2020
3.80%
3
3,946,507
05/31/2020
4.06%
2
67,707,604
05/31/2020
4.06%
2
67,707,604
05/31/2020
4.07%
2
3,208,285
05/31/2020
4.07%
2
3,208,285
05/31/2020
5.73%
2
7,215,987
05/31/2020
5.73%
2
7,215,987
05/31/2020
6.64%
2
1,375,472
06/30/2020
-5.28%
2
7,973,997
06/30/2020
-5.28%
2
7,973,997
06/30/2020
-3.05%
2
64,108,826
06/30/2020
-3.05%
2
64,108,826
06/30/2020
-0.57%
3
3,780,008
06/30/2020
-0.57%
3
3,780,008
06/30/2020
-0.25%
1
131,251
06/30/2020
-0.25%
1
131,251
06/30/2020
-0.13%
5
6,525,049
06/30/2020
-0.12%
1
876,764
06/30/2020
-0.10%
38
55,426,409
06/30/2020
-0.09%
56
67,985,274
06/30/2020
0.05%
8
12,303,263
06/30/2020
0.07%
4
5,738,423
06/30/2020
0.07%
4
5,738,423
06/30/2020
0.25%
14
10,170,224
06/30/2020
0.40%
3
5,778,214
06/30/2020
0.57%
1
876,764
06/30/2020
1.04%
5
748,849
06/30/2020
1.20%
3
923,431
06/30/2020
1.23%
2
1,375,085
06/30/2020
1.52%
1
264,452
06/30/2020
1.58%
16
6,248,363
07/31/2020
3.51%
1
135,880
07/31/2020
3.51%
1
135,880
07/31/2020
3.69%
1
274,147
07/31/2020
4.12%
5
780,113
07/31/2020
4.25%
3
963,079
07/31/2020
4.34%
5
6,789,587
07/31/2020
4.55%
17
7,048,932
07/31/2020
4.65%
8
12,858,821
07/31/2020
4.99%
3
6,069,234
07/31/2020
5.40%
1
924,225
07/31/2020
5.40%
1
924,225
07/31/2020
5.88%
15
11,589,975
07/31/2020
6.39%
55
66,256,347
07/31/2020
6.40%
36
52,267,392
07/31/2020
6.53%
4
6,110,480
07/31/2020
6.53%
4
6,110,480
07/31/2020
7.78%
3
1,745,846
07/31/2020
8.04%
3
4,084,546
07/31/2020
8.04%
3
4,084,546
07/31/2020
8.74%
2
69,725,754
07/31/2020
8.74%
2
69,725,754
07/31/2020
13.48%
2
9,049,945
07/31/2020
13.48%
2
9,049,945
08/31/2020
-0.75%
2
9,424,818
08/31/2020
-0.75%
2
9,424,818
08/31/2020
-0.23%
2
69,664,852
08/31/2020
-0.23%
2
69,664,852
08/31/2020
0.06%
1
136,008
08/31/2020
0.06%
1
136,008
08/31/2020
1.33%
3
4,138,030
08/31/2020
1.33%
3
4,138,030
08/31/2020
1.69%
5
6,901,700
08/31/2020
1.90%
8
13,100,436
08/31/2020
1.90%
55
67,763,929
08/31/2020
1.98%
36
53,386,291
08/31/2020
2.01%
1
942,836
08/31/2020
2.01%
1
942,836
08/31/2020
2.04%
4
6,238,338
08/31/2020
2.04%
4
6,238,338
08/31/2020
2.12%
3
6,198,737
08/31/2020
2.22%
6
903,855
08/31/2020
2.25%
15
12,023,495
08/31/2020
2.25%
1
280,283
08/31/2020
2.63%
3
988,131
08/31/2020
3.20%
18
7,935,891
08/31/2020
4.51%
3
1,808,157
09/30/2020
-3.54%
3
1,744,459
09/30/2020
-2.10%
18
7,764,483
09/30/2020
-1.74%
3
960,725
09/30/2020
-1.67%
1
275,628
09/30/2020
-1.45%
16
12,201,845
09/30/2020
-1.44%
1
929,223
09/30/2020
-1.44%
1
929,223
09/30/2020
-1.43%
6
890,598
09/30/2020
-1.18%
3
6,126,703
09/30/2020
-1.14%
9
15,369,176
09/30/2020
-1.13%
6
9,242,473
09/30/2020
-1.09%
57
70,317,295
09/30/2020
-1.07%
37
55,788,206
09/30/2020
-0.93%
3
4,019,020
09/30/2020
-0.93%
3
4,019,020
09/30/2020
-0.88%
4
6,176,091
09/30/2020
-0.88%
4
6,176,091
09/30/2020
-0.67%
1
135,113
09/30/2020
-0.67%
1
135,113
09/30/2020
1.07%
2
69,399,311
09/30/2020
1.07%
2
69,399,311
09/30/2020
1.27%
2
10,044,675
09/30/2020
1.27%
2
10,044,675
10/31/2020
-4.56%
2
9,504,311
10/31/2020
-4.56%
2
9,504,311
10/31/2020
-3.11%
3
3,931,798
10/31/2020
-3.11%
3
3,931,798
10/31/2020
-2.91%
2
66,867,186
10/31/2020
-2.91%
2
66,867,186
10/31/2020
-2.36%
3
1,703,371
10/31/2020
-2.27%
4
6,036,819
10/31/2020
-2.27%
4
6,036,819
10/31/2020
-2.15%
1
909,141
10/31/2020
-2.15%
1
909,141
10/31/2020
-1.99%
37
54,678,779
10/31/2020
-1.91%
16
11,958,224
10/31/2020
-1.86%
56
68,049,758
10/31/2020
-1.76%
3
6,021,472
10/31/2020
-1.75%
9
15,086,180
10/31/2020
-1.71%
6
9,064,709
10/31/2020
-1.53%
1
133,034
10/31/2020
-1.53%
1
133,034
10/31/2020
-1.27%
1
272,122
10/31/2020
-1.26%
3
948,516
10/31/2020
-1.25%
6
878,956
10/31/2020
-1.17%
19
7,800,940
11/30/2020
-9.31%
2
8,618,992
11/30/2020
-9.31%
2
8,618,992
11/30/2020
-5.73%
2
63,091,663
11/30/2020
-5.73%
2
63,091,663
11/30/2020
1.05%
3
3,970,251
11/30/2020
1.05%
3
3,970,251
11/30/2020
1.77%
1
135,367
11/30/2020
1.77%
1
135,367
11/30/2020
3.12%
55
67,683,448
11/30/2020
3.15%
36
53,567,086
11/30/2020
3.15%
6
9,906,221
11/30/2020
3.16%
4
6,208,630
11/30/2020
3.16%
4
6,208,630
11/30/2020
3.71%
9
16,215,576
11/30/2020
3.77%
1
943,313
11/30/2020
3.77%
1
943,313
11/30/2020
4.41%
16
12,640,819
11/30/2020
4.74%
3
6,309,356
11/30/2020
5.48%
6
927,092
11/30/2020
6.52%
3
1,004,243
11/30/2020
6.93%
1
291,028
11/30/2020
8.56%
19
8,381,874
11/30/2020
10.22%
3
1,877,217
12/31/2020
1.20%
1
136,977
12/31/2020
1.20%
1
136,977
12/31/2020
1.76%
2
64,198,411
12/31/2020
1.76%
2
64,198,411
12/31/2020
2.30%
8
11,380,587
12/31/2020
2.48%
11
17,816,330
12/31/2020
2.87%
1
970,242
12/31/2020
2.87%
1
970,242
12/31/2020
2.95%
3
6,435,743
12/31/2020
2.99%
3
4,089,360
12/31/2020
2.99%
3
4,089,360
12/31/2020
3.00%
1
299,783
12/31/2020
3.05%
55
67,820,797
12/31/2020
3.23%
6
956,956
12/31/2020
3.23%
35
52,943,357
12/31/2020
3.28%
4
6,408,863
12/31/2020
3.28%
4
6,408,863
12/31/2020
3.39%
3
1,037,175
12/31/2020
3.40%
16
13,115,741
12/31/2020
3.43%
2
8,247,725
12/31/2020
3.43%
2
8,247,725
12/31/2020
3.49%
20
10,597,603
12/31/2020
4.05%
4
2,018,942
01/31/2021
-9.36%
2
7,993,857
01/31/2021
-9.36%
2
7,993,857
01/31/2021
-9.11%
2
58,283,274
01/31/2021
-9.11%
2
58,283,274
01/31/2021
-3.72%
3
3,937,644
01/31/2021
-3.72%
3
3,937,644
01/31/2021
-2.12%
4
6,269,330
01/31/2021
-2.12%
4
6,269,330
01/31/2021
-1.91%
56
73,809,619
01/31/2021
-1.90%
37
59,018,523
01/31/2021
-1.68%
1
134,638
01/31/2021
-1.68%
1
134,638
01/31/2021
-1.64%
16
13,237,779
01/31/2021
-1.49%
1
955,665
01/31/2021
-1.49%
1
955,665
01/31/2021
-1.13%
11
17,609,203
01/31/2021
-1.11%
3
6,364,992
01/31/2021
-1.02%
8
11,244,211
01/31/2021
-0.58%
6
951,534
01/31/2021
-0.45%
4
2,010,033
01/31/2021
-0.22%
3
1,031,866
01/31/2021
0.06%
1
299,940
01/31/2021
0.16%
21
8,781,837
02/28/2021
-0.92%
1
133,400
02/28/2021
-0.92%
1
133,400
02/28/2021
0.88%
8
11,329,621
02/28/2021
1.17%
1
303,419
02/28/2021
1.24%
11
17,810,726
02/28/2021
1.41%
3
3,993,217
02/28/2021
1.41%
3
3,993,217
02/28/2021
1.52%
1
970,376
02/28/2021
1.52%
1
970,376
02/28/2021
1.78%
3
6,481,105
02/28/2021
2.04%
4
6,399,327
02/28/2021
2.06%
21
8,946,906
02/28/2021
2.07%
3
1,043,574
02/28/2021
2.08%
4
6,399,327
02/28/2021
2.08%
6
971,218
02/28/2021
2.09%
54
74,257,596
02/28/2021
2.11%
36
57,930,779
02/28/2021
2.21%
2
8,169,233
02/28/2021
2.21%
2
8,169,233
02/28/2021
2.26%
17
15,538,955
02/28/2021
4.89%
4
2,108,335
02/28/2021
6.17%
2
61,562,563
02/28/2021
6.17%
2
61,562,563
03/31/2021
-0.97%
1
132,103
03/31/2021
-0.97%
1
132,103
03/31/2021
-0.62%
4
2,076,304
03/31/2021
0.24%
8
11,337,998
03/31/2021
0.45%
1
304,770
03/31/2021
0.73%
16
15,160,936
03/31/2021
0.75%
6
978,953
03/31/2021
0.82%
11
17,947,694
03/31/2021
0.92%
3
1,053,212
03/31/2021
0.99%
20
8,863,263
03/31/2021
1.82%
3
6,609,696
03/31/2021
1.96%
1
989,638
03/31/2021
1.96%
1
989,638
03/31/2021
2.09%
53
75,241,928
03/31/2021
2.77%
36
59,274,063
03/31/2021
2.87%
4
6,668,994
03/31/2021
2.89%
4
6,668,994
03/31/2021
3.73%
3
4,141,995
03/31/2021
3.73%
3
4,141,995
03/31/2021
5.23%
2
64,647,880
03/31/2021
5.23%
2
64,647,880
03/31/2021
7.75%
2
8,799,162
03/31/2021
7.75%
2
8,799,162
04/30/2021
2.35%
1
135,191
04/30/2021
2.35%
1
135,191
04/30/2021
2.80%
4
2,133,835
04/30/2021
2.84%
8
11,692,923
04/30/2021
3.07%
1
314,115
04/30/2021
3.10%
11
18,541,872
04/30/2021
3.59%
3
6,848,950
04/30/2021
3.62%
6
1,014,242
04/30/2021
3.67%
3
1,091,846
04/30/2021
3.73%
53
77,436,189
04/30/2021
3.75%
36
61,560,345
04/30/2021
3.83%
20
9,196,904
04/30/2021
3.85%
17
15,875,844
04/30/2021
4.24%
1
1,031,530
04/30/2021
4.24%
1
1,031,530
04/30/2021
4.61%
4
6,976,092
04/30/2021
4.61%
4
6,976,092
04/30/2021
5.39%
2
68,125,299
04/30/2021
5.39%
2
68,125,299
04/30/2021
5.63%
3
4,373,558
04/30/2021
5.63%
3
4,373,558
04/30/2021
8.30%
2
9,528,656
04/30/2021
8.30%
2
9,528,656
05/31/2021
0.04%
4
2,134,542
05/31/2021
0.55%
1
135,920
05/31/2021
0.55%
1
135,920
05/31/2021
1.02%
8
11,823,405
05/31/2021
1.13%
2
67,731,747
05/31/2021
1.13%
2
67,731,747
05/31/2021
1.21%
11
18,769,080
05/31/2021
1.25%
6
1,027,335
05/31/2021
1.26%
56
81,141,984
05/31/2021
1.26%
3
4,429,350
05/31/2021
1.26%
3
4,429,350
05/31/2021
1.28%
39
64,943,772
05/31/2021
1.29%
17
16,198,212
05/31/2021
1.34%
3
1,106,390
05/31/2021
1.41%
1
318,581
05/31/2021
1.41%
3
6,945,675
05/31/2021
1.43%
5
7,542,936
05/31/2021
1.43%
4
7,086,109
05/31/2021
1.46%
2
9,666,984
05/31/2021
1.46%
2
9,666,984
05/31/2021
1.50%
21
10,108,573
05/31/2021
1.52%
1
1,047,060
05/31/2021
1.52%
1
1,047,060
06/30/2021
-9.46%
2
8,752,941
06/30/2021
-9.46%
2
8,752,941
06/30/2021
-5.86%
2
62,964,403
06/30/2021
-5.86%
2
62,964,403
06/30/2021
-2.84%
3
4,223,604
06/30/2021
-2.84%
3
4,223,604
06/30/2021
-1.76%
4
2,077,529
06/30/2021
-1.73%
4
6,963,888
06/30/2021
-1.55%
5
7,424,588
06/30/2021
-1.43%
1
1,031,984
06/30/2021
-1.43%
1
1,031,984
06/30/2021
-1.38%
18
16,650,472
06/30/2021
-1.24%
57
90,085,956
06/30/2021
-1.18%
37
62,323,903
06/30/2021
-0.85%
7
10,779,859
06/30/2021
-0.65%
11
18,587,213
06/30/2021
-0.61%
3
6,898,803
06/30/2021
-0.27%
5
852,983
06/30/2021
-0.02%
3
1,106,014
06/30/2021
0.22%
1
136,227
06/30/2021
0.22%
1
136,227
06/30/2021
0.67%
21
10,200,194
06/30/2021
1.58%
1
320,810
07/31/2021
-1.13%
4
2,053,355
07/31/2021
0.69%
21
10,274,606
07/31/2021
0.97%
1
339,049
07/31/2021
1.04%
3
1,110,864
07/31/2021
1.15%
5
862,969
07/31/2021
1.83%
3
7,025,873
07/31/2021
1.87%
7
10,971,787
07/31/2021
2.06%
12
21,644,350
07/31/2021
2.16%
1
139,156
07/31/2021
2.16%
1
139,156
07/31/2021
2.27%
18
17,106,592
07/31/2021
2.37%
1
1,056,538
07/31/2021
2.37%
1
1,056,538
07/31/2021
2.38%
57
91,670,805
07/31/2021
2.56%
37
63,194,763
07/31/2021
2.99%
4
7,176,560
07/31/2021
3.06%
4
7,176,560
07/31/2021
5.01%
3
4,435,402
07/31/2021
5.01%
3
4,435,402
07/31/2021
6.74%
2
67,057,191
07/31/2021
6.74%
2
67,057,191
07/31/2021
10.98%
2
9,739,683
07/31/2021
10.98%
2
9,739,683
08/31/2021
0.44%
1
139,761
08/31/2021
0.44%
1
139,761
08/31/2021
0.88%
21
10,416,130
08/31/2021
0.94%
8
11,975,294
08/31/2021
0.99%
1
342,360
08/31/2021
1.13%
3
1,117,785
08/31/2021
1.16%
6
1,046,119
08/31/2021
1.19%
12
22,005,566
08/31/2021
1.29%
3
7,117,297
08/31/2021
1.36%
1
1,071,045
08/31/2021
1.36%
1
1,071,045
08/31/2021
1.56%
39
66,282,381
08/31/2021
1.56%
58
94,035,534
08/31/2021
1.68%
18
17,398,665
08/31/2021
1.92%
4
7,311,186
08/31/2021
1.92%
4
7,311,186
08/31/2021
2.23%
4
2,100,759
08/31/2021
2.77%
3
4,517,508
08/31/2021
2.77%
3
4,517,508
08/31/2021
3.65%
2
68,847,407
08/31/2021
3.65%
2
68,847,407
08/31/2021
5.68%
2
9,600,317
08/31/2021
5.68%
2
9,600,317
09/30/2021
-4.25%
2
7,437,681
09/30/2021
-4.25%
2
7,437,681
09/30/2021
-3.81%
3
4,384,449
09/30/2021
-3.81%
3
4,384,449
09/30/2021
-3.60%
1
330,007
09/30/2021
-2.86%
1
1,030,619
09/30/2021
-2.86%
1
1,030,619
09/30/2021
-2.81%
21
46,371,327
09/30/2021
-2.78%
18
17,295,809
09/30/2021
-2.60%
4
7,118,785
09/30/2021
-2.60%
4
7,118,785
09/30/2021
-2.56%
3
1,089,379
09/30/2021
-2.44%
2
67,167,236
09/30/2021
-2.44%
2
67,167,236
09/30/2021
-2.43%
6
1,021,219
09/30/2021
-2.42%
3
6,947,756
09/30/2021
-2.38%
8
11,682,809
09/30/2021
-2.37%
4
2,031,622
09/30/2021
-2.32%
12
21,483,619
09/30/2021
-2.19%
1
136,731
09/30/2021
-2.19%
1
136,731
09/30/2021
-2.12%
39
64,355,527
09/30/2021
-2.11%
58
91,711,934
10/31/2021
2.13%
1
139,632
10/31/2021
2.13%
1
139,632
10/31/2021
2.88%
1
339,522
10/31/2021
3.02%
10
12,325,501
10/31/2021
3.15%
14
22,445,650
10/31/2021
3.19%
3
7,170,276
10/31/2021
3.28%
21
47,963,507
10/31/2021
3.36%
6
1,055,570
10/31/2021
3.41%
3
1,121,366
10/31/2021
3.64%
1
1,068,068
10/31/2021
3.64%
1
1,068,068
10/31/2021
3.79%
40
68,301,413
10/31/2021
3.87%
62
97,922,528
10/31/2021
4.14%
4
7,418,157
10/31/2021
4.14%
4
7,418,157
10/31/2021
4.53%
20
18,819,097
10/31/2021
5.81%
3
4,556,122
10/31/2021
5.81%
3
4,556,122
10/31/2021
6.37%
2
71,577,385
10/31/2021
6.37%
2
71,577,385
10/31/2021
6.85%
4
2,170,200
10/31/2021
9.81%
2
8,164,175
10/31/2021
9.81%
2
8,164,175
11/30/2021
-2.60%
4
2,112,834
11/30/2021
-2.14%
1
332,240
11/30/2021
-2.04%
22
47,183,546
11/30/2021
-1.71%
3
1,095,007
11/30/2021
-1.36%
6
1,041,470
11/30/2021
-1.20%
20
18,753,312
11/30/2021
-1.12%
60
94,113,883
11/30/2021
-1.00%
3
6,949,188
11/30/2021
-0.95%
1
1,057,773
11/30/2021
-0.95%
1
1,057,773
11/30/2021
-0.86%
14
21,195,045
11/30/2021
-0.79%
10
11,310,020
11/30/2021
-0.79%
38
64,641,213
11/30/2021
-0.44%
4
7,381,302
11/30/2021
-0.44%
4
7,381,302
11/30/2021
0.35%
1
140,136
11/30/2021
0.35%
1
140,136
11/30/2021
0.95%
3
4,599,724
11/30/2021
0.95%
3
4,599,724
11/30/2021
3.02%
2
73,742,356
11/30/2021
3.02%
2
73,742,356
11/30/2021
4.21%
2
8,508,506
11/30/2021
4.21%
2
8,508,506
12/31/2021
1.82%
1
338,214
12/31/2021
2.08%
1
143,035
12/31/2021
2.08%
1
143,035
12/31/2021
2.32%
3
1,732,797
12/31/2021
2.99%
21
48,409,522
12/31/2021
3.44%
3
7,191,134
12/31/2021
3.54%
6
1,078,909
12/31/2021
3.64%
10
11,749,044
12/31/2021
3.64%
3
1,134,595
12/31/2021
3.67%
14
21,994,834
12/31/2021
4.43%
38
72,234,350
12/31/2021
4.58%
1
1,106,000
12/31/2021
4.58%
1
1,106,000
12/31/2021
4.59%
59
92,294,360
12/31/2021
4.78%
4
7,732,633
12/31/2021
4.78%
4
7,732,633
12/31/2021
5.27%
20
19,748,663
12/31/2021
6.32%
3
4,890,088
12/31/2021
6.32%
3
4,890,088
12/31/2021
9.07%
2
80,633,248
12/31/2021
9.07%
2
80,633,248
12/31/2021
13.47%
2
9,652,268
12/31/2021
13.47%
2
9,652,268
01/31/2022
-10.62%
2
8,686,005
01/31/2022
-10.62%
2
8,686,005
01/31/2022
-7.07%
3
4,543,708
01/31/2022
-7.07%
3
4,543,708
01/31/2022
-6.47%
2
72,879,279
01/31/2022
-6.47%
2
72,879,279
01/31/2022
-5.42%
3
1,638,628
01/31/2022
-4.36%
4
7,394,177
01/31/2022
-4.36%
4
7,394,177
01/31/2022
-3.81%
38
70,087,052
01/31/2022
-3.70%
59
89,400,531
01/31/2022
-3.56%
20
19,011,109
01/31/2022
-3.56%
1
1,056,627
01/31/2022
-3.56%
1
1,056,627
01/31/2022
-3.55%
22
46,483,281
01/31/2022
-3.47%
1
138,089
01/31/2022
-3.47%
1
138,089
01/31/2022
-3.46%
3
6,942,071
01/31/2022
-3.14%
14
21,092,024
01/31/2022
-2.99%
1
328,108
01/31/2022
-2.79%
9
10,491,725
01/31/2022
-2.67%
3
1,100,051
01/31/2022
-2.58%
6
1,051,042
02/28/2022
-0.74%
22
47,004,609
02/28/2022
-0.62%
1
137,248
02/28/2022
-0.62%
1
137,248
02/28/2022
-0.54%
1
326,341
02/28/2022
-0.27%
3
1,096,951
02/28/2022
-0.07%
9
10,164,873
02/28/2022
-0.06%
6
1,050,061
02/28/2022
0.26%
14
20,966,714
02/28/2022
0.37%
20
18,845,496
02/28/2022
0.37%
3
6,967,899
02/28/2022
0.45%
1
1,061,563
02/28/2022
0.45%
1
1,061,563
02/28/2022
0.66%
58
91,014,738
02/28/2022
1.00%
37
70,934,627
02/28/2022
1.01%
4
7,469,012
02/28/2022
1.01%
4
7,469,012
02/28/2022
1.23%
3
1,658,870
02/28/2022
1.27%
4
5,350,734
02/28/2022
1.27%
4
5,350,734
02/28/2022
3.37%
2
75,335,736
02/28/2022
3.37%
2
75,335,736
02/28/2022
4.84%
4
11,335,595
02/28/2022
4.84%
4
11,335,595
03/31/2022
-0.33%
1
136,803
03/31/2022
-0.33%
1
136,803
03/31/2022
-0.10%
2
4,207,419
03/31/2022
0.66%
23
47,465,577
03/31/2022
1.58%
9
10,298,673
03/31/2022
1.73%
13
18,221,853
03/31/2022
1.99%
3
1,114,357
03/31/2022
2.18%
6
1,072,753
03/31/2022
2.24%
3
7,043,240
03/31/2022
2.46%
4
2,038,158
03/31/2022
2.70%
1
1,090,071
03/31/2022
2.70%
1
1,090,071
03/31/2022
3.39%
23
37,233,848
03/31/2022
3.50%
62
110,878,153
03/31/2022
3.66%
37
72,057,896
03/31/2022
3.91%
4
7,748,550
03/31/2022
3.91%
4
7,748,550
03/31/2022
4.66%
4
5,599,203
03/31/2022
4.66%
4
5,599,203
03/31/2022
6.70%
2
80,257,142
03/31/2022
6.70%
2
80,257,142
03/31/2022
10.27%
4
12,494,866
03/31/2022
10.27%
4
12,494,866
04/30/2022
-6.51%
4
1,905,412
04/30/2022
-5.64%
22
43,960,293
04/30/2022
-5.33%
2
3,982,472
04/30/2022
-4.38%
4
5,280,266
04/30/2022
-4.38%
4
5,280,266
04/30/2022
-4.07%
2
857,709
04/30/2022
-3.97%
5
857,095
04/30/2022
-3.82%
3
6,772,564
04/30/2022
-3.66%
1
131,814
04/30/2022
-3.66%
1
131,814
04/30/2022
-3.51%
12
16,710,860
04/30/2022
-3.33%
22
35,897,293
04/30/2022
-3.24%
9
9,938,296
04/30/2022
-3.23%
1
1,054,734
04/30/2022
-3.23%
1
1,054,734
04/30/2022
-3.08%
62
115,063,057
04/30/2022
-2.89%
37
77,706,893
04/30/2022
-2.81%
4
7,613,131
04/30/2022
-2.81%
4
7,613,131
04/30/2022
2.64%
2
82,348,395
04/30/2022
2.64%
2
82,348,395
04/30/2022
3.69%
5
13,980,933
04/30/2022
3.69%
5
13,980,933
05/31/2022
-0.16%
22
44,011,468
05/31/2022
-0.13%
3
4,666,809
05/31/2022
0.26%
2
859,991
05/31/2022
0.47%
5
861,036
05/31/2022
0.57%
1
132,546
05/31/2022
0.57%
1
132,546
05/31/2022
0.75%
3
6,822,820
05/31/2022
0.92%
12
16,850,071
05/31/2022
1.12%
9
10,027,251
05/31/2022
1.48%
61
122,189,274
05/31/2022
1.64%
37
84,216,952
05/31/2022
1.65%
1
1,072,200
05/31/2022
1.65%
1
1,072,200
05/31/2022
1.66%
22
37,194,530
05/31/2022
1.98%
4
7,608,728
05/31/2022
1.98%
4
7,608,728
05/31/2022
6.09%
4
5,495,925
05/31/2022
6.09%
4
5,495,925
05/31/2022
7.05%
3
93,295,690
05/31/2022
7.05%
3
93,295,690
05/31/2022
7.07%
4
2,039,686
05/31/2022
10.55%
5
15,345,936
05/31/2022
10.55%
5
15,345,936
06/30/2022
-14.38%
3
1,649,597
06/30/2022
-13.69%
6
13,968,291
06/30/2022
-13.69%
6
13,968,291
06/30/2022
-9.02%
4
5,000,567
06/30/2022
-9.02%
4
5,000,567
06/30/2022
-8.66%
3
85,232,183
06/30/2022
-8.66%
3
85,232,183
06/30/2022
-7.21%
22
34,521,992
06/30/2022
-6.69%
1
1,000,205
06/30/2022
-6.69%
1
1,000,205
06/30/2022
-6.67%
4
7,062,054
06/30/2022
-6.67%
4
7,062,054
06/30/2022
-6.16%
59
111,335,108
06/30/2022
-5.82%
2
805,963
06/30/2022
-5.81%
36
76,375,142
06/30/2022
-5.65%
5
812,562
06/30/2022
-5.61%
11
17,424,002
06/30/2022
-5.58%
14
23,867,900
06/30/2022
-5.55%
3
6,443,897
06/30/2022
-5.32%
22
41,524,107
06/30/2022
-4.80%
3
4,443,149
06/30/2022
-3.91%
1
127,359
06/30/2022
-3.91%
1
127,359
07/31/2022
3.52%
3
87,941,940
07/31/2022
3.52%
3
87,941,940
07/31/2022
3.59%
1
131,930
07/31/2022
3.59%
1
131,930
07/31/2022
4.16%
5
846,394
07/31/2022
4.30%
58
115,762,839
07/31/2022
4.31%
36
79,608,912
07/31/2022
4.40%
11
18,248,649
07/31/2022
4.41%
1
1,044,244
07/31/2022
4.41%
1
1,044,244
07/31/2022
4.53%
2
839,205
07/31/2022
4.54%
14
24,990,214
07/31/2022
4.55%
3
4,644,260
07/31/2022
4.62%
3
6,741,565
07/31/2022
4.82%
22
36,153,927
07/31/2022
4.87%
4
7,574,344
07/31/2022
4.87%
4
7,574,344
07/31/2022
5.05%
6
14,877,815
07/31/2022
5.05%
6
14,877,815
07/31/2022
5.15%
4
5,256,819
07/31/2022
5.15%
4
5,256,819
07/31/2022
5.45%
21
43,639,336
07/31/2022
7.94%
4
1,884,339
08/31/2022
-5.98%
6
13,989,896
08/31/2022
-5.98%
6
13,989,896
08/31/2022
-4.63%
4
5,014,354
08/31/2022
-4.63%
4
5,014,354
08/31/2022
-4.14%
1
1,000,880
08/31/2022
-4.14%
1
1,000,880
08/31/2022
-3.91%
4
7,278,031
08/31/2022
-3.91%
4
7,278,031
08/31/2022
-3.80%
22
34,833,375
08/31/2022
-3.74%
13
21,861,860
08/31/2022
-3.74%
3
4,471,393
08/31/2022
-3.68%
10
15,368,322
08/31/2022
-3.67%
3
6,493,538
08/31/2022
-3.63%
1
127,135
08/31/2022
-3.63%
1
127,135
08/31/2022
-3.61%
61
111,905,476
08/31/2022
-3.55%
38
76,895,798
08/31/2022
-3.49%
3
84,758,677
08/31/2022
-3.49%
3
84,758,677
08/31/2022
-3.47%
20
41,218,482
08/31/2022
-3.03%
2
813,973
08/31/2022
-2.77%
5
823,364
08/31/2022
0.96%
4
1,902,926
09/30/2022
-12.44%
6
12,249,416
09/30/2022
-12.44%
6
12,249,416
09/30/2022
-10.34%
4
4,496,143
09/30/2022
-10.34%
4
4,496,143
09/30/2022
-8.91%
3
1,638,004
09/30/2022
-8.31%
4
6,616,143
09/30/2022
-8.31%
4
6,616,143
09/30/2022
-8.22%
1
918,626
09/30/2022
-8.22%
1
918,626
09/30/2022
-7.92%
21
30,159,964
09/30/2022
-7.78%
20
37,804,257
09/30/2022
-7.60%
38
70,937,437
09/30/2022
-7.52%
60
101,259,635
09/30/2022
-7.39%
3
78,499,877
09/30/2022
-7.39%
3
78,499,877
09/30/2022
-7.25%
3
4,146,955
09/30/2022
-7.10%
13
20,401,212
09/30/2022
-7.07%
10
14,361,191
09/30/2022
-6.99%
3
6,040,021
09/30/2022
-6.49%
1
118,893
09/30/2022
-6.41%
2
747,324
09/30/2022
-5.85%
5
775,347
09/30/2022
-3.08%
2
535,958
10/31/2022
1.87%
1
121,141
10/31/2022
1.87%
1
121,141
10/31/2022
2.68%
2
3,628,219
10/31/2022
3.83%
20
39,206,187
10/31/2022
4.52%
2
781,011
10/31/2022
4.54%
5
810,411
10/31/2022
4.63%
10
15,011,662
10/31/2022
4.71%
13
21,350,327
10/31/2022
4.93%
3
6,338,664
10/31/2022
5.83%
1
972,290
10/31/2022
5.83%
1
972,290
10/31/2022
6.36%
22
32,998,529
10/31/2022
6.67%
60
108,658,654
10/31/2022
6.80%
38
75,660,125
10/31/2022
7.47%
3
4,892,980
10/31/2022
7.47%
3
4,892,980
10/31/2022
9.92%
4
4,941,990
10/31/2022
9.92%
4
4,941,990
10/31/2022
10.58%
3
83,252,397
10/31/2022
10.58%
3
83,252,397
10/31/2022
15.20%
4
1,998,238
10/31/2022
16.81%
6
14,311,115
10/31/2022
16.81%
6
14,311,115
11/30/2022
1.99%
4
2,038,972
11/30/2022
2.38%
3
85,207,201
11/30/2022
2.38%
3
85,207,201
11/30/2022
3.35%
6
14,790,112
11/30/2022
3.35%
6
14,790,112
11/30/2022
4.35%
1
126,405
11/30/2022
4.35%
1
126,405
11/30/2022
4.43%
3
6,619,358
11/30/2022
4.73%
5
848,211
11/30/2022
4.74%
12
22,042,474
11/30/2022
4.76%
8
15,180,572
11/30/2022
4.77%
37
77,698,605
11/30/2022
4.89%
22
34,624,037
11/30/2022
4.89%
59
112,322,642
11/30/2022
4.94%
3
5,081,238
11/30/2022
4.94%
3
5,081,238
11/30/2022
5.00%
4
5,188,392
11/30/2022
5.00%
4
5,188,392
11/30/2022
5.04%
2
812,200
11/30/2022
5.34%
1
1,024,176
11/30/2022
5.34%
1
1,024,176
11/30/2022
5.91%
21
41,515,949
11/30/2022
6.09%
3
4,515,175
12/31/2022
-11.64%
6
13,061,579
12/31/2022
-11.64%
6
13,061,579
12/31/2022
-7.43%
4
4,802,689
12/31/2022
-7.43%
4
4,802,689
12/31/2022
-7.12%
3
77,082,623
12/31/2022
-7.12%
3
77,082,623
12/31/2022
-5.40%
3
1,666,798
12/31/2022
-5.37%
3
4,803,149
12/31/2022
-5.04%
36
69,174,815
12/31/2022
-4.98%
4
5,224,036
12/31/2022
-4.85%
60
103,358,533
12/31/2022
-4.79%
24
34,183,719
12/31/2022
-4.70%
1
976,113
12/31/2022
-4.70%
1
976,113
12/31/2022
-3.81%
3
6,268,971
12/31/2022
-3.77%
8
14,702,732
12/31/2022
-3.76%
11
20,971,703
12/31/2022
-3.46%
21
40,095,177
12/31/2022
-3.25%
1
122,292
12/31/2022
-3.25%
1
122,292
12/31/2022
-3.16%
2
786,585
12/31/2022
-3.02%
5
822,708
12/31/2022
-2.92%
3
4,350,624
01/31/2023
0.68%
3
77,636,137
01/31/2023
0.68%
3
77,636,137
01/31/2023
1.04%
6
13,188,415
01/31/2023
1.04%
6
13,188,415
01/31/2023
2.29%
4
1,947,452
01/31/2023
3.62%
5
5,819,535
01/31/2023
3.74%
61
116,672,231
01/31/2023
3.75%
36
71,723,008
01/31/2023
3.96%
3
6,515,848
01/31/2023
3.99%
3
4,995,993
01/31/2023
4.03%
4
4,995,973
01/31/2023
4.03%
4
4,995,973
01/31/2023
4.20%
25
44,949,223
01/31/2023
4.29%
1
1,018,103
01/31/2023
4.29%
1
1,018,103
01/31/2023
4.30%
8
15,337,036
01/31/2023
4.31%
11
21,852,884
01/31/2023
4.41%
1
127,680
01/31/2023
4.41%
1
127,680
01/31/2023
4.83%
4
740,028
01/31/2023
5.11%
2
822,969
01/31/2023
5.84%
3
4,604,045
01/31/2023
6.44%
23
42,612,397
02/28/2023
-12.88%
6
11,943,023
02/28/2023
-12.88%
6
11,943,023
02/28/2023
-8.45%
3
71,037,542
02/28/2023
-8.45%
3
71,037,542
02/28/2023
-7.57%
4
4,618,255
02/28/2023
-7.57%
4
4,618,255
02/28/2023
-5.76%
3
4,704,096
02/28/2023
-5.58%
36
69,038,688
02/28/2023
-5.25%
1
950,092
02/28/2023
-5.25%
1
950,092
02/28/2023
-5.05%
61
106,860,922
02/28/2023
-4.97%
5
5,526,376
02/28/2023
-4.69%
25
37,822,234
02/28/2023
-4.24%
3
6,240,532
02/28/2023
-4.08%
11
21,172,665
02/28/2023
-4.04%
8
14,932,132
02/28/2023
-3.81%
1
122,820
02/28/2023
-3.81%
1
122,820
02/28/2023
-3.71%
2
790,920
02/28/2023
-3.56%
3
4,428,998
02/28/2023
-3.42%
22
40,891,981
02/28/2023
-3.27%
4
715,704
02/28/2023
-2.69%
4
1,894,732
03/31/2023
0.06%
4
1,819,164
03/31/2023
1.19%
22
41,217,011
03/31/2023
1.43%
2
802,345
03/31/2023
1.54%
1
964,911
03/31/2023
1.54%
1
964,911
03/31/2023
1.59%
4
727,279
03/31/2023
1.83%
3
4,000,583
03/31/2023
1.85%
4
4,621,584
03/31/2023
1.85%
4
4,621,584
03/31/2023
2.10%
6
12,192,286
03/31/2023
2.10%
6
12,192,286
03/31/2023
2.26%
7
7,745,573
03/31/2023
2.36%
10
14,062,843
03/31/2023
2.37%
3
6,317,270
03/31/2023
2.38%
25
36,967,300
03/31/2023
2.63%
61
108,094,151
03/31/2023
2.63%
5
5,764,868
03/31/2023
2.98%
36
71,126,852
03/31/2023
2.98%
3
4,939,626
03/31/2023
3.07%
1
126,606
03/31/2023
3.07%
1
126,606
03/31/2023
5.62%
3
75,023,074
03/31/2023
5.62%
3
75,023,074
04/30/2023
0.18%
1
425,109
04/30/2023
0.46%
4
1,827,968
04/30/2023
0.61%
23
41,622,381
04/30/2023
0.90%
3
4,036,885
04/30/2023
1.39%
2
813,599
04/30/2023
1.64%
1
128,697
04/30/2023
1.64%
1
128,697
04/30/2023
1.64%
4
734,051
04/30/2023
2.03%
7
7,896,292
04/30/2023
2.05%
10
14,350,883
04/30/2023
2.06%
1
984,683
04/30/2023
2.06%
1
984,683
04/30/2023
2.22%
3
6,454,591
04/30/2023
2.49%
5
5,911,766
04/30/2023
2.55%
26
38,176,575
04/30/2023
2.74%
64
117,387,517
04/30/2023
2.90%
3
5,084,204
04/30/2023
3.05%
38
79,210,943
04/30/2023
3.07%
4
4,761,983
04/30/2023
3.07%
4
4,761,983
04/30/2023
5.70%
6
12,890,218
04/30/2023
5.70%
6
12,890,218
04/30/2023
5.91%
3
79,344,961
04/30/2023
5.91%
3
79,344,961
05/31/2023
-12.03%
5
1,862,248
05/31/2023
-12.03%
5
1,862,248
05/31/2023
-11.62%
2
786,026
05/31/2023
-11.62%
2
786,026
05/31/2023
-6.36%
4
4,459,656
05/31/2023
-6.36%
4
4,459,656
05/31/2023
-6.15%
38
74,213,439
05/31/2023
-5.75%
65
109,357,918
05/31/2023
-5.61%
3
4,796,569
05/31/2023
-5.48%
27
35,144,479
05/31/2023
-4.96%
5
5,619,197
05/31/2023
-4.31%
3
6,176,314
05/31/2023
-4.12%
11
15,182,931
05/31/2023
-4.06%
1
944,551
05/31/2023
-4.06%
1
944,551
05/31/2023
-3.88%
4
1,756,755
05/31/2023
-3.85%
8
9,006,617
05/31/2023
-3.19%
1
124,585
05/31/2023
-3.19%
1
124,585
05/31/2023
-2.92%
4
712,628
05/31/2023
-2.75%
2
779,408
05/31/2023
-2.04%
3
3,880,281
05/31/2023
-1.78%
22
40,759,058
05/31/2023
-0.77%
1
421,740
06/30/2023
2.10%
1
127,209
06/30/2023
2.10%
1
127,209
06/30/2023
2.57%
3
3,963,504
06/30/2023
3.49%
24
42,472,939
06/30/2023
3.58%
8
9,117,513
06/30/2023
3.91%
1
981,433
06/30/2023
3.91%
1
981,433
06/30/2023
4.01%
11
15,566,126
06/30/2023
4.06%
2
807,521
06/30/2023
4.18%
3
537,516
06/30/2023
4.38%
3
6,448,613
06/30/2023
5.77%
5
6,258,952
06/30/2023
5.94%
28
37,402,822
06/30/2023
6.00%
3
5,083,516
06/30/2023
6.01%
66
116,281,515
06/30/2023
6.32%
38
78,878,693
06/30/2023
6.54%
4
4,669,705
06/30/2023
6.54%
4
4,669,705
06/30/2023
6.79%
4
1,858,338
06/30/2023
7.52%
1
765,567
06/30/2023
10.37%
3
75,682,854
06/30/2023
10.37%
3
75,682,854
06/30/2023
10.65%
6
12,694,910
06/30/2023
10.65%
6
12,694,910
07/31/2023
-6.98%
6
11,807,851
07/31/2023
-6.98%
6
11,807,851
07/31/2023
-6.46%
3
70,733,529
07/31/2023
-6.46%
3
70,733,529
07/31/2023
-1.71%
4
4,591,865
07/31/2023
-1.71%
4
4,591,865
07/31/2023
-0.85%
38
77,940,644
07/31/2023
-0.64%
1
126,389
07/31/2023
-0.64%
1
126,389
07/31/2023
-0.57%
65
114,267,894
07/31/2023
-0.47%
3
5,060,847
07/31/2023
0.03%
5
7,140,723
07/31/2023
0.07%
3
6,454,341
07/31/2023
0.28%
11
15,592,792
07/31/2023
0.31%
26
29,748,748
07/31/2023
0.32%
8
9,138,451
07/31/2023
0.64%
1
987,536
07/31/2023
0.64%
1
987,536
07/31/2023
0.66%
1
1,655,263
07/31/2023
1.45%
4
1,884,519
07/31/2023
1.47%
3
545,374
07/31/2023
1.99%
2
823,871
07/31/2023
2.26%
3
3,953,572
07/31/2023
2.67%
23
43,190,680
08/31/2023
-2.96%
4
1,828,747
08/31/2023
-2.29%
23
42,105,908
08/31/2023
-2.18%
3
3,867,604
08/31/2023
-1.72%
2
809,644
08/31/2023
-1.49%
3
537,097
08/31/2023
-1.37%
25
29,084,167
08/31/2023
-1.32%
1
1,533,373
08/31/2023
-1.27%
1
124,785
08/31/2023
-1.27%
1
124,785
08/31/2023
-1.12%
10
21,848,460
08/31/2023
-1.04%
1
976,930
08/31/2023
-1.04%
1
976,930
08/31/2023
-1.02%
13
28,252,559
08/31/2023
-0.87%
5
6,970,095
08/31/2023
-0.78%
3
6,404,099
08/31/2023
-0.75%
63
108,492,084
08/31/2023
-0.64%
4
4,562,530
08/31/2023
-0.64%
4
4,562,530
08/31/2023
-0.64%
3
5,020,965
08/31/2023
-0.47%
37
72,924,463
08/31/2023
1.93%
6
12,034,906
08/31/2023
1.93%
6
12,034,906
08/31/2023
2.06%
2
69,927,836
08/31/2023
2.06%
2
69,927,836
09/30/2023
-9.10%
6
10,938,637
09/30/2023
-9.10%
6
10,938,637
09/30/2023
-8.73%
2
63,815,468
09/30/2023
-8.73%
2
63,815,468
09/30/2023
-7.70%
1
1,430,591
09/30/2023
-6.73%
26
27,459,009
09/30/2023
-6.69%
4
4,260,064
09/30/2023
-6.69%
4
4,260,064
09/30/2023
-6.39%
3
1,594,533
09/30/2023
-6.15%
64
96,836,330
09/30/2023
-5.95%
38
69,377,320
09/30/2023
-5.75%
5
6,576,226
09/30/2023
-5.66%
3
4,738,158
09/30/2023
-5.32%
1
118,145
09/30/2023
-5.32%
1
118,145
09/30/2023
-5.14%
9
17,706,727
09/30/2023
-5.01%
12
23,820,426
09/30/2023
-4.60%
1
932,167
09/30/2023
-4.60%
1
932,167
09/30/2023
-4.55%
3
6,113,699
09/30/2023
-4.18%
2
768,546
09/30/2023
-4.11%
3
514,903
09/30/2023
-3.94%
22
39,901,045
09/30/2023
-3.84%
3
3,704,266
10/31/2023
-4.85%
3
1,516,922
10/31/2023
-2.95%
22
39,394,230
10/31/2023
-2.42%
3
3,615,400
10/31/2023
-2.22%
1
1,400,357
10/31/2023
-2.14%
2
747,238
10/31/2023
-1.90%
25
23,808,532
10/31/2023
-1.89%
1
115,904
10/31/2023
-1.89%
1
115,904
10/31/2023
-1.88%
12
30,481,039
10/31/2023
-1.86%
10
26,148,491
10/31/2023
-1.81%
1
905,256
10/31/2023
-1.81%
1
905,256
10/31/2023
-1.79%
2
4,332,549
10/31/2023
-1.79%
3
505,527
10/31/2023
-1.62%
4
4,189,794
10/31/2023
-1.62%
4
4,189,794
10/31/2023
-1.56%
5
6,477,759
10/31/2023
-1.54%
63
92,534,502
10/31/2023
-1.48%
3
4,668,113
10/31/2023
-1.42%
38
68,725,970
10/31/2023
0.25%
6
10,968,760
10/31/2023
0.25%
6
10,968,760
10/31/2023
0.45%
1
63,484,079
10/31/2023
0.45%
1
63,484,079
11/30/2023
6.06%
3
3,833,971
11/30/2023
6.52%
2
783,063
11/30/2023
6.53%
3
538,525
11/30/2023
6.74%
22
41,158,440
11/30/2023
7.07%
1
969,412
11/30/2023
7.07%
1
969,412
11/30/2023
7.22%
3
6,349,238
11/30/2023
7.25%
1
124,297
11/30/2023
7.25%
1
124,297
11/30/2023
7.75%
13
31,600,883
11/30/2023
7.86%
10
25,251,645
11/30/2023
8.89%
3
5,083,568
11/30/2023
8.91%
62
99,758,305
11/30/2023
8.95%
5
7,056,725
11/30/2023
9.22%
38
74,591,221
11/30/2023
9.43%
24
25,167,083
11/30/2023
9.97%
4
4,580,292
11/30/2023
9.97%
4
4,580,292
11/30/2023
10.40%
1
1,545,389
11/30/2023
10.73%
4
1,784,310
11/30/2023
12.73%
1
71,385,238
11/30/2023
12.73%
1
71,385,238
11/30/2023
13.26%
6
12,632,725
11/30/2023
13.26%
6
12,632,725
12/31/2023
3.47%
6
13,038,595
12/31/2023
3.47%
6
13,038,595
12/31/2023
3.54%
3
557,669
12/31/2023
3.67%
9
25,486,976
12/31/2023
3.76%
1
1,005,949
12/31/2023
3.76%
1
1,005,949
12/31/2023
3.81%
1
73,441,550
12/31/2023
3.81%
1
73,441,550
12/31/2023
3.87%
12
32,085,959
12/31/2023
3.88%
2
810,067
12/31/2023
3.91%
1
129,151
12/31/2023
3.91%
1
129,151
12/31/2023
3.93%
3
6,598,982
12/31/2023
3.95%
62
104,078,857
12/31/2023
4.22%
37
76,846,273
12/31/2023
4.22%
4
6,910,374
12/31/2023
4.25%
1
1,611,080
12/31/2023
4.25%
3
5,299,293
12/31/2023
4.26%
3
3,981,729
12/31/2023
4.27%
25
27,232,584
12/31/2023
4.68%
4
4,795,415
12/31/2023
4.68%
4
4,795,415
12/31/2023
4.79%
4
1,851,128
12/31/2023
5.34%
22
42,975,252
01/31/2024
-0.88%
21
42,061,570
01/31/2024
-0.48%
3
3,963,044
01/31/2024
1.54%
2
817,544
01/31/2024
2.30%
3
570,631
01/31/2024
2.40%
3
6,753,645
01/31/2024
3.00%
1
133,002
01/31/2024
3.00%
1
133,002
01/31/2024
4.23%
12
33,427,184
01/31/2024
4.40%
37
80,038,699
01/31/2024
4.51%
1
1,051,226
01/31/2024
4.51%
1
1,051,226
01/31/2024
4.65%
9
26,673,540
01/31/2024
5.01%
63
109,879,571
01/31/2024
5.10%
3
5,567,581
01/31/2024
5.17%
4
1,926,713
01/31/2024
5.66%
4
7,298,580
01/31/2024
6.98%
25
29,363,367
01/31/2024
7.44%
1
1,731,000
01/31/2024
9.96%
4
5,273,468
01/31/2024
9.96%
4
5,273,468
01/31/2024
18.65%
1
86,550,563
01/31/2024
18.65%
1
86,550,563
01/31/2024
24.69%
6
14,749,794
01/31/2024
24.69%
6
14,749,794
02/29/2024
1.38%
3
4,019,060
02/29/2024
2.04%
21
42,909,270
02/29/2024
2.22%
1
135,968
02/29/2024
2.22%
1
135,968
02/29/2024
3.32%
3
6,977,523
02/29/2024
3.60%
2
843,058
02/29/2024
3.97%
3
593,375
02/29/2024
4.45%
1
1,098,216
02/29/2024
4.45%
1
1,098,216
02/29/2024
4.51%
12
34,918,057
02/29/2024
4.70%
9
27,940,534
02/29/2024
5.09%
37
83,627,686
02/29/2024
5.36%
3
5,858,182
02/29/2024
5.70%
61
112,789,770
02/29/2024
6.21%
4
7,740,101
02/29/2024
7.13%
4
2,063,704
02/29/2024
7.53%
24
29,162,085
02/29/2024
7.93%
4
5,591,399
02/29/2024
7.93%
4
5,591,399
02/29/2024
8.70%
1
1,881,919
02/29/2024
13.40%
2
97,850,071
02/29/2024
13.40%
2
97,850,071
02/29/2024
16.09%
7
17,234,537
02/29/2024
16.09%
7
17,234,537
03/31/2024
1.85%
1
138,477
03/31/2024
1.85%
1
138,477
03/31/2024
2.19%
3
4,091,929
03/31/2024
2.57%
3
7,155,902
03/31/2024
2.60%
22
44,181,130
03/31/2024
2.71%
2
862,946
03/31/2024
2.87%
3
610,221
03/31/2024
3.01%
13
36,729,220
03/31/2024
3.10%
10
29,573,318
03/31/2024
3.17%
37
86,412,075
03/31/2024
3.18%
1
1,133,202
03/31/2024
3.18%
1
1,133,202
03/31/2024
3.36%
62
119,190,203
03/31/2024
3.53%
3
6,062,480
03/31/2024
3.73%
4
2,123,327
03/31/2024
3.94%
5
8,607,647
03/31/2024
4.17%
25
32,778,128
03/31/2024
4.55%
4
5,845,933
03/31/2024
4.55%
4
5,845,933
03/31/2024
4.57%
1
1,967,702
03/31/2024
6.49%
2
103,389,333
03/31/2024
6.49%
2
103,389,333
03/31/2024
7.63%
7
17,889,411
03/31/2024
7.63%
7
17,889,411
Asset Classes
The following table shows the Asset Classes that are available throughout the website, the market index that is used to represent each asset class, and the estimated fee that is deducted from the performance of the index.
Strategy Portal
Our Strategy Portal and its content is intended as a research tool. Individual client performance, holdings, etc. could differ from the information displayed in this portal.
All daily, month-to-date, year-to-date, and since inceptions returns are estimates.
A disclosure crawl appears at the top of the page indicating periods that are actual returns and those that are simulated. If the period selected for display and/or analysis includes both simulated and actual performance, these will be combined as one.
An enhancement to the strategy, designed to improve returns during the early months following a sharp market decline and following rally, was implemented in March 2021. Therefore, performance data is accessible for the strategy both with and without the enhancement.
The strategy is offered with varying fee structures. Therefore, performance data is accessible for the strategy net the various fee structures. Furthermore, the strategy's gross return (no deduction for management fees or performance fees) is also accessible.
Portfolio Analysis Portal: Our Portfolio Analysis Portal and its content is intended to be a research tool. All performance is simulated (it is NOT actual performance of any clients). The performance is based on the selected portfolio and allocation of that portfolio. For more details on the simulated portfolios selected, see the "Compare Allocations" report from the Dashboard.
Patton Flex Strategy - the following is a description of the various performance data available:
Performance History Types
Research Returns: an enhancement to the Strategy was implemented in March 2021. All performance data for all periods reflects the impact of this Strategy enhancement. Returns for April 2021 and later are actual returns and all prior to this date are simulated.
Real Returns from Inception: all performance data from February 2010, the inception date of the Strategy, are actual returns and all prior to this date are simulated. The Strategy enhancement implemented in March 2021 is NOT reflected in any of the performance data.
Fee Type
Management Fee: the Strategy performance is net of a 1.50% management fee.
Performance Fee: the Strategy performance is net of a 0.00% management fee and 50% performance fee above 12% annually.
None: this is the gross performance of the Strategy with no management fees and no performance fees deducted.
Any combination of "Performance History Type" and "Fee Type" can be selected to access the described performance data.
The Flex Strategy was launched in February 2010. There is backtested research from July 1963. All returns prior to February 2010 are backtested. Furthermore, an enhancement was made to the Strategy implemented March 2021. The Research Returns allow you to see how the Strategy would have performed had this enhancement been in place since the Strategy inception.
Audacity Strategy - the following is a description of the various performance data available:
Performance History Type
Research Returns: an enhancement to the Strategy was implemented in March 2021. All performance data for all periods reflects the impact of this Strategy enhancement. Returns for April 2021 and later are actual returns and all prior to this date are simulated.
Real Returns since Inception: all performance data from April 2020, the inception date of the Strategy, are actual returns and all prior to this date are simulated. The Strategy enhancement implemented in March 2021 is NOT reflected in any of the performance data.
Fee Type
Management Fee: the Strategy performance is net of a 4.00% management fee.
Performance Fee: the Strategy performance is net of a 2.00% management fee and 20% performance fee above 0% annually.
None: this is the gross performance of the Strategy with no management fees and no performance fees deducted.
Any combination of "Performance History Type" and "Fee Type" can be selected to access the described performance data.
The Audacity Strategy was launched in April 2020. There is backtested research from July 1963. All returns prior to April 2020 are backtested. Furthermore, an enhancement was made to the Strategy implemented March 2021. The Research Returns allow you to see how the Strategy would have performed had this enhancement been in place since the Strategy inception.
Access Exclusive Content
Please login or subscribe to our news letter to access the Exclusive Content.
If you have already subscribed then please enter your Email address