
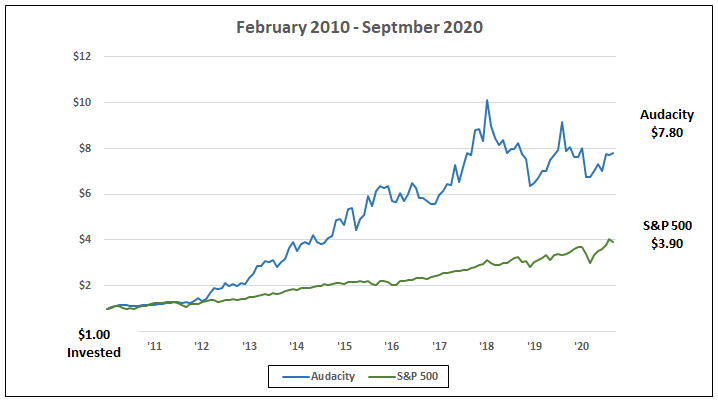
The Audacity Strategy is a turbocharged version of Patton's existing hedging strategy designed to produce returns that are 2 - 4 times the S&P 500 with a risk profile, based on various metrics, similar to that of the S&P 500. The existing strategy has proven successful over the last 10 years making it one of the top performing long/short U.S. equity strategies in the world since its launch in February 2010. In addition to 10 years of proven success, the Strategy is supported by research spanning 5 decades of market data.
Be the best performing long/short U.S. equity strategy in the world over the next decade.
Goal of 2 – 4 times the S&P 500
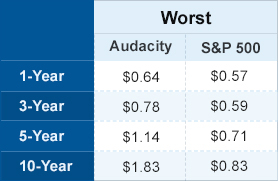
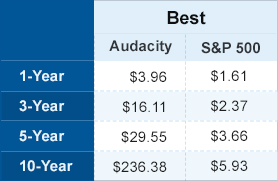
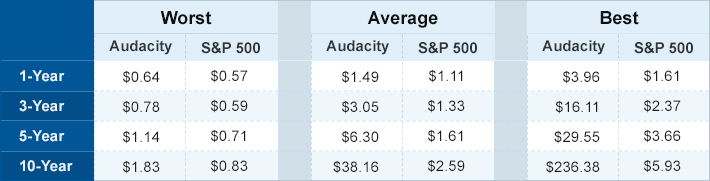
Audacity has research extending back to 1963. Based upon this research, the following table shows the average growth of $1 invested over various periods of time. For example, over the average 5-Year period, $1 invested in Audacity grew to $6.30 as compared to the average $1 invested in the S&P 500 growing to just $1.61. The Worst and Best outcomes are provided below.
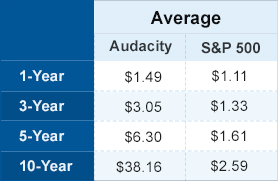
All performance numbers are shown net of all estimated fees and expenses. Audacity’s simulated net performance since July 1963 is +41.6% compounded annually.
Investing in the Audacity Strategy requires taking a bold but very calculated risk. The Strategy is a repeatable, purely mathematical process designed to systematically take advantage of other investors' poor human behavior. It is supported by both proven success and extensive research and testing.
Here are some highlights:
Audacity is unlike nearly every other high performing strategy of the past decade in that it is NOT reliant on the S&P 500 going higher to produce a strong return. Mathematics, specifically the statistic R-Squared, illustrates this characteristic.
R-Squared: measures the portion, or %, of an investments performance that is the result of the S&P 500’s performance.
Strong positive performance is NOT dependent on the S&P 500 going higher. For nearly every high performing fund of the past decade to continue going higher, the S&P 500 must continue going higher. That is NOT the case for Audacity as it’s low R-Squared suggests it can perform well regardless of the S&P 500’s performance.
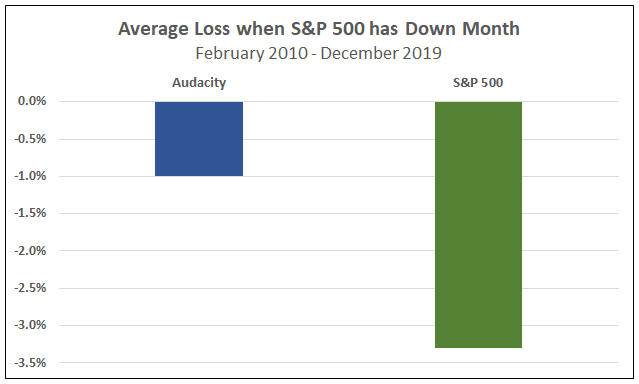
An additional benefit of investment strategies with a low R-Squared is the possibility of reduced losses during times when the market is down. During the past 10 years, the S&P 500 has been down 33 months. During these 33 months, the S&P 500 averaged a loss of -3.3% while Audacity was down just -1.0% on average during these same 33 months.
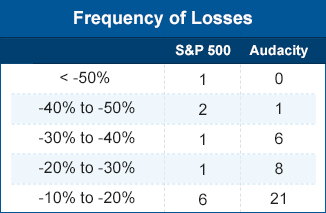
Volatility is the biggest price you will pay for the high expected returns of the Audacity Strategy. This is a high octane strategy with significant gains and losses often occurring rapidly as illustrated in the accompanying table.
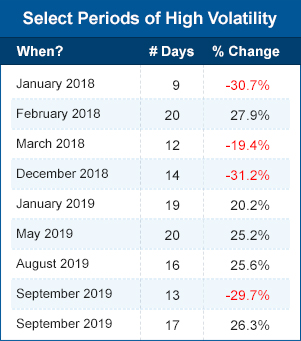
Although the maximum drawdown is worse for the S&P 500, the Audacity experiences more frequent drawdowns of less magnitude as illustrated in the table.
The accompanying table shows the value of $1.00 invested over various lengths of time.
An investment in the Audacity should come from the equity allocation in your portfolio. Select an allocation below to see the impact of various allocations to Audacity.
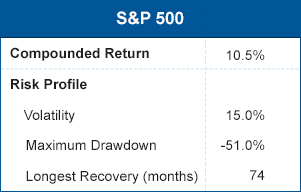
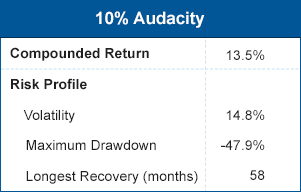
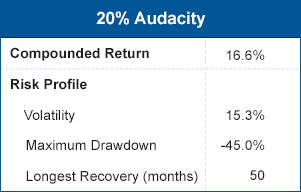

| 0% Audacity | 10% Audacity | 20% Audacity | 30% Audacity | |
| Compounded Return | 10.5% | 13.5% | 16.6% | 19.5% |
| Risk Profile | ||||
| Volatility | 15.0% | 14.8% | 15.3% | 16.4% |
| Maximum Drawdown | -51.0% | -47.9% | -45.0% | -43.3% |
| Longest Recovery (months) | 74 | 58 | 50 | 49 |
Audacity Strategy is Patton’s existing hedging strategy. See: https://www.pattonwealth.com/audacity.html
All Audacity performance calculations are simulated and net of estimated fees.
Calculations are based on monthly returns unless otherwise stated.
Analysis Period: 12/31/1971 - 11/30/2019 unless otherwise noted.
Please login or subscribe to our news letter to access the Exclusive Content.
If you have already subscribed then please enter your Email address
IMPORTANT NOTICE: INFORMATION ABOUT PAST PERFORMANCE
Not indicative of future returns. Past performance is not indicative of future returns, which may vary. Accordingly, future returns are not guaranteed and there can be no assurance that any Patton Fund, Strategy, or Portfolio (“Patton Investments”) will achieve comparable investment results or its investment objective. You may lose money on your investment in a Patton Investment.
Strategy Developed based on Back-testing. The investment strategies used by Patton were developed, in part, by back-testing its investment program against past market and economic conditions. In other words, the strategies were designed to succeed based on knowledge of events that occurred in the past. One limitation of such a strategy is that it is inherently focused on the past, and cannot necessarily take account of market and economic conditions that may arise in the future. If future market and economic conditions are different from past market and economic conditions, and if investors behave differently from past investors, Patton’s investment strategies may not work as anticipated and the Strategy, Fund, or any Patton Investments, may lose money.
Fees and Distributions. The performance information shown reflects the deduction of actual expenses of the applicable Patton Investment for periods during which the Patton Investment has been in operation (see below). The performance figures shown reflect the reinvestment of all dividends, interest and other income, and assume that the applicable Patton Investment has not made any distributions to investors. Estimated fees and expenses including brokerage commissions, borrowing costs, and advisory fees, have been deducted from all back-tested performance.
Portfolio Characteristics. Portfolio characteristics, including specific holdings, contributors to performance, and country, sector and industry exposure, are shown as of the date indicated only, and are subject to change without notice. Portfolio characteristics are designed to illustrate the application of the Patton Investments’ investment style only, and should not be considered a recommendation.
Third Party Information. Information contained herein is based on data obtained from statistical services, company reports or communications, or other sources. Patton Fund Management believes these sources to be reliable. However, we have not verified this information, and we make no representations whatsoever as to its accuracy or completeness.
IMPORTANT NOTICE: INFORMATION ABOUT BACK-TESTED PAST PERFORMANCE
Performance results may be presented that pre-dates the commencement of operations of a Patton Investment Strategy. Because the Patton Investment Strategy was not in operation during certain periods shown, the performance information prior to the date the Patton Investment Strategy commenced operations is back-tested performance (sometimes referred to as hypothetical performance).
Patton Investment Strategies Inception Dates (first full month)
There are several important factors to consider when reviewing back-tested, or hypothetical, performance information:
Back-tested Performance is Hypothetical. The performance information shown for the Patton Investment Strategy you select includes performance information that is hypothetical, and is not real nor based on an actual portfolio managed by Patton. As such, the back-tested portion of the performance presentation does not represent the investment performance or the actual Patton Investment Strategy or any investors in the Patton Investment Strategy. The securities in these hypothetical portfolios were selected with the full benefit of hindsight, after their performance over the period shown was known. It is not likely that similar results could be achieved in the future. The back-tested results may not reflect the impact that any material market or economic factors might have had on the results if the Strategy had been used during the period to actually manage client assets. Furthermore, back-testing does not reflect how Patton actually might have reacted when managing client investments to economic and market events. The hypothetical portfolios presented here are purely illustrative, and representative only of a small sample of possible future scenarios.
Back-testing is Subject to Limitations. While it is believed that back-tested performance information presented is relevant to evaluating an investment in the Patton Investment Strategy, no representation is or could be made that the information presents what the performance results would have been in the past or are likely to be in the future. There are frequently sharp differences between hypothetical performance results and actual performance results subsequently achieved. One limitation of hypothetical performance is that it is generally prepared with the benefit of hindsight. In addition, no hypothetical track record can completely account for the impact of financial risk in actual trading. For example, back-factors that affect markets in general, the impact of fees and expenses, market liquidity and other factors may all have affected actual performance.
Actual Investor Experience Varies. The back-tested results are not indicative of the skill of Patton. For example, each Patton Investment Strategy began trading on the date indicated above. Back-tested performance shown for each Patton Investment Strategy reflects hypothetical performance determined using the current investment strategy of the applicable Patton Investment Strategy. However, Patton has been managing money using quantitative strategies since 2001. During this period Patton has experienced periods of poor performance and Patton has closed other Patton Investment Strategies that it has managed as a result of poor performance. Investors in some of Patton’s closed Strategies (and funds) have lost money.
Back-testing Period. During the back-tested period, Patton was either not providing investment advice or was not providing investment advice according to the Strategy used to calculate the back-tested results.
Indices. The historical performance of various indices, such as the S&P 500 Index, may be included. An index is an unmanaged, broad-based market index and investing in any Patton Investment Strategy is not similar to investing in an index. An index is not available for direct investment, and the securities in an index will not match the Strategy's holdings. In addition, unlike an index, the Strategy's performance will be affected by fees and expenses.
Forward-looking Statements. Any forward-looking statements represent the subjective views of Patton and their validity may be affected by events and conditions not now contemplated and by other factors, many of which may be beyond Patton's control. Actual results may vary and such variations may be material, and no representation or warranty is made regarding any forward-looking information contained herein.
Super-Diversification Flex Growth Strategy
"Patton Clients" is a composite of the actual NET performance (net of all actual management fees, performance fees, transaction costs, custodial fees, and any other expenses) of our clients utilizing our Super-Diversification Flex Growth Strategy totaling approximately $151,895,041 of assets. Generally all portfolios in excess of $100,000 in value and without major restrictions are included in the composite. Portfolios are generally added to the composite for their first full month and removed after their last full month of availability. Our Strategy and process has remained consistent over the entire period. Not all Patton Clients with the same strategy experienced the same performance due primarly to minor differences in allocations, differences in fees and other restrictions and limitations. A very limited number of Patton Clients pay fees from money outside of their portfolio resulting in a higher return. Some clients are Qualified Clients and Accredited Investors as defined by the SEC and may pay a performance-based fee which can meaningfully impact performance. Daily returns are geometrically linked. Returns are gross of taxes.
Use of leverage on a portion of the portfolios represented by this composite return has had a material impact on the performance figures displayed.
Performance includes the reinvestment of dividends and other earnings. Investors may lose money, and are expected to lose money, during significant market declines and other market conditions, in this strategy.
The asset allocation of the strategy has been different than the ARC Private Client Index, resulting in differing performance, although the risk profiles of both have been generally similar. During the period being reported the market has been in an upward trend that has been stronger than historic averages. There is no assurance that this type of trend will persist or how we would perform if it did.
All other representations of Super-Diversification performance throughout our website is back-tested simulated results unless otherwise noted.
ARC Private Client Index
The ARC Private Client Index is an index created by and maintained by the ARC Group. These indexes were selected as comparables because they measure the performance of professionally managed diversified portfolios. These indexes consist of more than 350,000+ actual investor portfolio returns that are managed by 137 investment managers (as of June 2026) including some of the largest in the world. These 137 managers only represent a sample of the 10,000's of investment managers and other such service providers (financial planners, traditional brokers, etc.). Performance is net of fees.
There are 4 Private Client Indexes each with a different risk profile. We have selected for dsiplay the ARC Private Client Index with the most comparable risk profile, Steady Growth (allocation approximately 52.4% equities, 18.5% Fixed Income, 7.9% Cash, and 21.2% Other as of June 2026), to our Patton Clients performance.
For more information about these indexes, visit the ARC Group's website here.
Industry benchmarks presented for comparison to Super-Diversified Portfolios are believed to be comparable risk portfolios although the holdings are very likely significantly different. Simulated portfolio benchmarks, such as a "Traditional Portfolio", does have a similar risk profile but is allocated only to traditional asset classes of stocks, bonds, and cash.
IMPORTANT NOTICE: INFORMATION ABOUT MODEL PORTFOLIO PERFORMANCE
Unless otherwise noted, the performance of all portfolios ("Model Portfolios") are simulations of various combinations of asset classes used to simulate the performance of various types of portfolios with various risk profiles. All Model Portfolios for all time periods are back-tested hypothetical simulated results.
Model Portfolios have been developed based on historical performance of the described indexes for the relevant time period using our proprietary process and do not represent the results of actual trading of investor assets. Model portfolio allocations were selected with the benefit of hindsight. Model performance has inherent limitations. Since these are simulated portfolios (hypothetical) and do not reflect any investor's actual experience with owning, trading or managing an actual investment account, there can be no assurance that an investor would have achieved similar rates of return over the time frame. Thus, the performance shown does not reflect the impact that material economic and market factors (lack of liquidity and other such factors) had or might have had on decision making if actual investor money had been managed. In addition, since the time period in question is a historical one, there can be no assurance that future results achieved by investors will in any way resemble those represented by the Model Portfolios. Model Portfolios are rebalanced monthly. All performance data is total returns which includes interest and dividends. The calculations are net of the estimated management and/or performance fees, trading costs, and fund expense ratios (see below table for estimated expense ratios by Asset Class) if applicable. Performance does not reflect the deduction of other fees or expenses, including but not limited to brokerage account fees, custodial fees, and fees and expenses charged by mutual funds, exchange traded funds, and other investment companies that may be in addition to the expense ratio (these additional expenses tend to be extremely low). Taxes are not considered.
Our presentation of hypothetical model portfolio performance is intended only for website visitors who have the resource and financial expertise to understand the inherent limitations and risks associated with such data.
The following describes how a model portfolio monthly return is calculated:
Model Portfolios presented on our website are portfolios blended from various indexes. The blended asset allocation of every Model Portfolio is readily available within the website. The benchmark index(es) used to represent each asset class is disclosed elsewhere in this disclosure. We do adjust the performance of the benchmark indexes for fees of an applicable fund available to invest in that index or asset class.
When a Model Portfolio's performance is compared to a single benchmark index, such as the S&P 500, the index has not been selected to represent an appropriate benchmark to compare an investor's performance, but rather are disclosed to allow for comparison of the investor's performance, for the convenience of the investor, to that of certain well-known and widely recognized indices. Indices are typically not available for direct investment, are unmanaged, and do not incur fees or expenses.
The goal of a portfolio is not to outperform any single index. The objective of a portfolio is total return. All portfolios are subject to the risk of loss. Patton was not necessarily managing portfolios similar to any given model portfolio. Model Portfolios are not indicative of the skill of Patton nor the performance of portfolios managed by Patton.
The performance calculations of all Model Portfolios have not been audited by any third party. Actual performance of client portfolios may differ materially due to the timing related to additional client deposits or withdrawals and the actual deployment and investment of a client portfolio, the length of time various positions are held, the client’s objectives and restrictions, and fees and expenses incurred by any specific individual portfolio.
Any presentation of two portfolios for comparison is generally intended to have a similar risk profile. Some Model Portfolios are more diversified than others such as Patton's Super-Diversified Portfolios generally including more asset classes than more traditional portfolios. Generally the purpose of such presentations is to demonstrate the impact of added diversification.
Although we have done our best to present this information fairly, hypothetical performance is still potentially misleading. Hypothetical data does not represent actual performance and should not be interpreted as an indication of actual performance. This data is based on transactions that were not made. Instead, the trades were simulated, based on knowledge that was available only after the fact and thus with the benefit of hindsight. Results do not include the impact of taxes, if any. Past performance is not indicative of future performance.
Although performance analysis is precise by nature, the analysis is generally intended to provide general ideas about how different portfolio allocations compare to one another.
Please contact us with any questions and/or additional explanation.
Client Performance Reporting
Client performance reporting, illustrated as the "Family", in the password protected areas of our webiste, including our Super-Diversified Portfolio Statements section, does represent the actual performance of an individual client's portfolio. Returns are shown net of fees, deposits, and withdrawals. These returns are calculated consistent with industry standards (returns are linked for periods upon a deposit or withdrawal).
Every effort is made to insure correct calculations. Please notify Patton if you believe your returns do not appear correct.
For clients with an investment in a Patton hedge fund / L.P., all current date valuations and daily returns for hedge fund investments are an estimate. These estimates are based on your most recent actual month-end balance, if applicable, and incremented by the estimated daily percent change. Month-end market valuations are actual once the hedge fund statement has been posted to the website.
Performance for specific asset classes does NOT represent the actual performance for the client; this performance is for the asset class based on the assumptions and descriptions made in our Asset Classes Descriptions in our full disclosure.
Any reference to the "Benchmark" portfolio is a simulated portfolio. This does not represent actual returns. It is used as a simulated benchmark to compare to the client's actual performance. See the "Benchmark Portfolio" report in the Dashboard reports for details about the asset allocation and more of the Benchmark Portfolio. See our disclosure regarding hypothetical model portfolios.
Asset Classes
The following table shows the Asset Classes that are available throughout the website, the market index that is used to represent each asset class, and the estimated fee that is deducted from the performance of the index.
| Asset Class Description | Assumed Fee | Index | Index Fund | Start | End |
|---|---|---|---|---|---|
| U.S. Large-Cap | 0.095% | S&P 500 IndexThe Standard and Poor's 500, or simply the S&P 500,[5] is a stock market index tracking the stock performance of 500 large companies listed on stock exchanges in the United States. It is one of the most commonly followed equity indices. As of December 31, 2020, more than $5.4 trillion was invested in assets tied to the performance of the index. | State Street SPDR S&P 500 ETF (SPY) | 06/30/1963 | 05/31/2026 |
| Russell 1000 | 0.150% | Russell 1000 IndexThe Russell 1000 Index is a stock market index that tracks the highest-ranking 1,000 stocks in the Russell 3000 Index, which represent about 93% of the total market capitalization of that index. As of 31 December 2021, the stocks of the Russell 1000 Index had a weighted average market capitalization of $608.1 billion and a median market capitalization of $15.1 billion. As of 8 May 2020, components ranged in market capitalization from $1.8 billion to $1.4 trillion.[1] The index, which was launched on January 1, 1984, is maintained by FTSE Russell, a subsidiary of the London Stock Exchange Group. | iShares Russell 1000 ETF (IWB) | 06/30/1988 | 05/31/2026 |
| S&P 500 IndexThe Standard and Poor's 500, or simply the S&P 500,[5] is a stock market index tracking the stock performance of 500 large companies listed on stock exchanges in the United States. It is one of the most commonly followed equity indices. As of December 31, 2020, more than $5.4 trillion was invested in assets tied to the performance of the index. | State Street SPDR S&P 500 ETF (SPY) | 06/30/1963 | 06/30/1988 | ||
| U.S. Large-Cap Equal Weight | 0.200% | S&P 500 Equal Weighted IndexThe S&P 500® Equal Weight Index (EWI) is the equal-weight version of the widely-used S&P 500. The index includes the same constituents as the capitalization weighted S&P 500, but each company in the S&P 500 EWI is allocated a fixed weight - or 0.2% of the index total at each quarterly rebalance. | n/a | 12/31/1970 | 05/31/2026 |
| S&P 500 IndexThe Standard and Poor's 500, or simply the S&P 500,[5] is a stock market index tracking the stock performance of 500 large companies listed on stock exchanges in the United States. It is one of the most commonly followed equity indices. As of December 31, 2020, more than $5.4 trillion was invested in assets tied to the performance of the index. | State Street SPDR S&P 500 ETF (SPY) | 06/30/1963 | 12/31/1970 | ||
| U.S. Large-Cap Growth | 0.180% | Russell 1000 Growth IndexThe Russell 1000® Growth Index measures the performance of the largecap growth segment of the US equity universe. It includes those Russell 1000 companies with relatively higher price-to-book ratios, higher I/B/E/S forecast medium term (2 year) growth and higher sales per share historical growth (5 years). The Russell 1000® Growth Index is constructed toprovide a comprehensive and unbiased barometer for the large-cap growth segment. The index is completely reconstituted annually to ensure new and growing equities are included and that the represented companies continue to reflect growth characteristics. | iShares Russell 1000 Growth ETF (IWF) | 12/31/1990 | 05/31/2026 |
| S&P 500 Growth IndexThe S&P 500 Growth Index is a stock index administered by Standard & Poor's-Dow Jones Indices. As its name suggests, the purpose of the index is to serve as a proxy for growth companies included in the S&P 500. The index identifies growth stocks using three factors: sales growth, the ratio of earnings change to price, and momentum. | n/a | 10/31/1985 | 12/31/1990 | ||
| S&P 500 IndexThe Standard and Poor's 500, or simply the S&P 500,[5] is a stock market index tracking the stock performance of 500 large companies listed on stock exchanges in the United States. It is one of the most commonly followed equity indices. As of December 31, 2020, more than $5.4 trillion was invested in assets tied to the performance of the index. | State Street SPDR S&P 500 ETF (SPY) | 06/30/1963 | 10/31/1985 | ||
| U.S. Large-Cap Value | 0.180% | Russell 1000 Value IndexThe Russell 1000® Value Index measures the performance of the largecap value segment of the US equity universe. It includes those Russell 1000 companies with relatively lower price-to-book ratios, lower I/B/E/S forecast medium term (2 year) growth and lower sales per share historical growth (5 years). The Russell 1000® Value Index is constructed to provide a comprehensive and unbiased barometer for the large-cap value segment. The index is completely reconstituted annually to ensure new and growing equities are included and that the represented companies continue to reflect value characteristics. | iShares Russell 1000 Value ETF (IWD) | 12/31/1990 | 05/31/2026 |
| S&P 500 Value IndexThe term S&P 500 Pure Value Index refers to a score-weighted index developed by Standard and Poor's (S&P). The index uses what it calls a "style-attractiveness-weighting scheme" and only consists of stocks within the S&P 500 Index that exhibit strong value characteristics. The index was launched in 2005 and consists of 120 constituents, the majority of which are financial services companies.The index was previously called the S&P 500/Citigroup Pure Value Index because of the relationship between Standard and Poor's, and Citigroup. | n/a | 10/31/1985 | 12/31/1990 | ||
| S&P 500 IndexThe Standard and Poor's 500, or simply the S&P 500,[5] is a stock market index tracking the stock performance of 500 large companies listed on stock exchanges in the United States. It is one of the most commonly followed equity indices. As of December 31, 2020, more than $5.4 trillion was invested in assets tied to the performance of the index. | State Street SPDR S&P 500 ETF (SPY) | 06/30/1963 | 10/31/1985 | ||
| U.S. Mid-Cap | 0.180% | Russell Mid-Cap IndexThe Russell Midcap® Index measures the performance of the mid-cap segment of the US equity universe. The Russell Midcap Index is a subset of the Russell 1000® Index. It includes approximately 800 of the smallest securities based on a combination of their market cap and current index membership. The Russell Midcap® Index represents approximately 27% of the total market capitalization of the Russell 1000® companies, as of the most recent reconstitution. The Russell Midcap Index is constructed to provide a comprehensive and unbiased barometer for the mid-cap segment. The index is completely reconstituted annually to ensure larger stocks do not distort the performance and characteristics of the true midcap opportunity set. | iShares Russell Mid-Cap ETF (IWR) | 06/30/1988 | 05/31/2026 |
| S&P 400 IndexThe S&P MidCap 400 Index, more commonly known as the S&P 400, is a stock market index from S&P Dow Jones Indices. The index serves as a gauge for the U.S. mid-cap equities sector and is the most widely followed mid-cap index. | n/a | 10/31/1985 | 06/30/1988 | ||
| CRSP U.S. Stocks Deciles 6-8CRSP Cap-Based Portfolio Index data are a monthly series based on portfolios that are rebalanced quarterly. The methodology used to calculate the series differs from the CRSP Stock File Capitalization Decile Indexes.The universe includes all common stocks listed on the NYSE, NYSE MKT, and NASDAQ National Market excluding Unit Investment Trusts, Closed-End Funds, REITs, Americus Trusts, foreign stocks and American Depositary Receipts. Eligible companies with primary listings on the NYSE are ranked into equally populated deciles. The largest capitalizations in each decile serve as the breakpoints that are applied to various exchange groupings of the universe.Individual decile portfolios are created for each exchange group, the largest being in decile 1 and the smallest in decile 10. This index measures the combined performance of Deciles 6 - 8. | n/a | 06/30/1963 | 10/31/1985 | ||
| U.S. Mid-Cap Growth | 0.230% | Russell Mid-Cap Growth IndexThe Russell Midcap® Growth Index measures the performance of the midcap growth segment of the US equity universe. It includes those Russell Midcap Index companies with relatively higher price-to-book ratios, higher I/B/E/S forecast medium term (2 year) growth and higher sales per share historical growth (5 years). The Russell Midcap® Growth Index is constructed to provide a comprehensive and unbiased barometer of the mid-cap growth market. The index is completely reconstituted annually to ensure larger stocks do not distort the performance and characteristics of the true mid-cap growth market. | iShares Russell Mid-Cap Growth ETF (IWP) | 06/30/1988 | 05/31/2026 |
| S&P 400 IndexThe S&P MidCap 400 Index, more commonly known as the S&P 400, is a stock market index from S&P Dow Jones Indices. The index serves as a gauge for the U.S. mid-cap equities sector and is the most widely followed mid-cap index. | n/a | 10/31/1985 | 06/30/1988 | ||
| CRSP U.S. Stocks Deciles 6-8CRSP Cap-Based Portfolio Index data are a monthly series based on portfolios that are rebalanced quarterly. The methodology used to calculate the series differs from the CRSP Stock File Capitalization Decile Indexes.The universe includes all common stocks listed on the NYSE, NYSE MKT, and NASDAQ National Market excluding Unit Investment Trusts, Closed-End Funds, REITs, Americus Trusts, foreign stocks and American Depositary Receipts. Eligible companies with primary listings on the NYSE are ranked into equally populated deciles. The largest capitalizations in each decile serve as the breakpoints that are applied to various exchange groupings of the universe.Individual decile portfolios are created for each exchange group, the largest being in decile 1 and the smallest in decile 10. This index measures the combined performance of Deciles 6 - 8. | n/a | 06/30/1963 | 10/31/1985 | ||
| U.S. Mid-Cap Value | 0.230% | Russell Mid-Cap Value IndexThe Russell Midcap® Value Index measures the performance of the midcap value segment of the US equity universe. It includes those Russell Midcap Index companies with relatively lower price-to-book ratios, lower I/B/E/S forecast medium term (2 year) growth and lower sales per share historical growth (5 years). The Russell Midcap Value Index is constructed to provide a comprehensive and unbiased barometer of the mid-cap value market. The index is completely reconstituted annually to ensure larger stocks do not distort the performance and characteristics of the true midcap value market. | iShares Russell Mid-Cap Value ETF (IWS) | 06/30/1988 | 05/31/2026 |
| S&P 400 IndexThe S&P MidCap 400 Index, more commonly known as the S&P 400, is a stock market index from S&P Dow Jones Indices. The index serves as a gauge for the U.S. mid-cap equities sector and is the most widely followed mid-cap index. | n/a | 10/31/1985 | 06/30/1988 | ||
| CRSP U.S. Stocks Deciles 6-8CRSP Cap-Based Portfolio Index data are a monthly series based on portfolios that are rebalanced quarterly. The methodology used to calculate the series differs from the CRSP Stock File Capitalization Decile Indexes.The universe includes all common stocks listed on the NYSE, NYSE MKT, and NASDAQ National Market excluding Unit Investment Trusts, Closed-End Funds, REITs, Americus Trusts, foreign stocks and American Depositary Receipts. Eligible companies with primary listings on the NYSE are ranked into equally populated deciles. The largest capitalizations in each decile serve as the breakpoints that are applied to various exchange groupings of the universe.Individual decile portfolios are created for each exchange group, the largest being in decile 1 and the smallest in decile 10. This index measures the combined performance of Deciles 6 - 8. | n/a | 06/30/1963 | 10/31/1985 | ||
| U.S. Small-Cap | 0.190% | Russell 2000 IndexThe term Russell 2000 Index refers to a stock market index that measures the performance of the 2,000 smaller companies included in the Russell 3000 Index. The Russell 2000 is managed by London's FTSE Russell Group and is widely regarded as a bellwether of the U.S. economy because of its focus on smaller companies that focus on the U.S. market. | iShares Russell 2000 ETF (IWM) | 12/31/1978 | 05/31/2026 |
| CRSP U.S. Stocks Deciles 0-5CRSP Cap-Based Portfolio Index data are a monthly series based on portfolios that are rebalanced quarterly. The methodology used to calculate the series differs from the CRSP Stock File Capitalization Decile Indexes. The universe includes all common stocks listed on the NYSE, NYSE MKT, and NASDAQ National Market excluding Unit Investment Trusts, Closed-End Funds, REITs, Americus Trusts, foreign stocks and American Depositary Receipts. Eligible companies with primary listings on the NYSE are ranked into equally populated deciles. The largest capitalizations in each decile serve as the breakpoints that are applied to various exchange groupings of the universe. Individual decile portfolios are created for each exchange group, the largest being in decile 1 and the smallest in decile 10. This index measures the combined performance of Deciles 0 - 5. | n/a | 06/30/1963 | 12/31/1978 | ||
| S&P 500 IndexThe Standard and Poor's 500, or simply the S&P 500,[5] is a stock market index tracking the stock performance of 500 large companies listed on stock exchanges in the United States. It is one of the most commonly followed equity indices. As of December 31, 2020, more than $5.4 trillion was invested in assets tied to the performance of the index. | State Street SPDR S&P 500 ETF (SPY) | 06/30/1963 | 06/30/1963 | ||
| U.S. Small-Cap Growth | 0.240% | Russell 2000 Growth IndexThe Russell 2000® Growth Index measures the performance of the smallcap growth segment of the US equity universe. It includes those Russell 2000 companies with relatively higher price-to-book ratios, higher I/B/E/S forecast medium term (2 year) growth and higher sales per share historical growth (5 years). The Russell 2000 Growth Index is constructed to provide a comprehensive and unbiased barometer for the small-cap growth segment. The index is completely reconstituted annually to ensure new and growing equities are included and that the represented companies continue to reflect growth characteristics. | iShares Russell 2000 Growth ETF (IWO) | 06/30/1988 | 05/31/2026 |
| Russell 2000 IndexThe term Russell 2000 Index refers to a stock market index that measures the performance of the 2,000 smaller companies included in the Russell 3000 Index. The Russell 2000 is managed by London's FTSE Russell Group and is widely regarded as a bellwether of the U.S. economy because of its focus on smaller companies that focus on the U.S. market. | iShares Russell 2000 ETF (IWM) | 12/31/1978 | 06/30/1988 | ||
| CRSP U.S. Stocks Deciles 0-5CRSP Cap-Based Portfolio Index data are a monthly series based on portfolios that are rebalanced quarterly. The methodology used to calculate the series differs from the CRSP Stock File Capitalization Decile Indexes. The universe includes all common stocks listed on the NYSE, NYSE MKT, and NASDAQ National Market excluding Unit Investment Trusts, Closed-End Funds, REITs, Americus Trusts, foreign stocks and American Depositary Receipts. Eligible companies with primary listings on the NYSE are ranked into equally populated deciles. The largest capitalizations in each decile serve as the breakpoints that are applied to various exchange groupings of the universe. Individual decile portfolios are created for each exchange group, the largest being in decile 1 and the smallest in decile 10. This index measures the combined performance of Deciles 0 - 5. | n/a | 06/30/1963 | 12/31/1978 | ||
| Dow Industrials | 0.160% | Dow Jones Industrial IndexThe Dow Jones® Industrial AverageSM (DJIA) is composed of thirty (30) “blue-chip” U.S. stocks. At 100-plus years, it is the oldest continuing U.S. market index. The DJIA has evolved into the most recognizable stock indicator in the world, and the only index composed of companies that have sustained earnings performance over a significant period of time.It is a price-weighted measurement stock market index of 30 prominent (Blue Chip) companies listed on stock exchanges in the United States. | n/a | 06/30/1963 | 05/31/2026 |
| U.S. Small-Cap Value | 0.240% | Russell 2000 Value IndexThe Russell 2000® Value Index measures the performance of the smallcap value segment of the US equity universe. It includes those Russell 2000 companies with relatively lower price-to-book ratios, lower I/B/E/S forecast medium term (2 year) growth and lower sales per share historical growth (5 years). The Russell 2000 Value Index is constructed to provide a comprehensive and unbiased barometer for the small-cap value segment. The index is completely reconstituted annually to ensure new and growing equities are included and that the represented companies continue to reflect value characteristics. | iShares Russell 2000 Value ETF (IWN) | 06/30/1988 | 05/31/2026 |
| Russell 2000 IndexThe term Russell 2000 Index refers to a stock market index that measures the performance of the 2,000 smaller companies included in the Russell 3000 Index. The Russell 2000 is managed by London's FTSE Russell Group and is widely regarded as a bellwether of the U.S. economy because of its focus on smaller companies that focus on the U.S. market. | iShares Russell 2000 ETF (IWM) | 12/31/1978 | 06/30/1988 | ||
| CRSP U.S. Stocks Deciles 0-5CRSP Cap-Based Portfolio Index data are a monthly series based on portfolios that are rebalanced quarterly. The methodology used to calculate the series differs from the CRSP Stock File Capitalization Decile Indexes. The universe includes all common stocks listed on the NYSE, NYSE MKT, and NASDAQ National Market excluding Unit Investment Trusts, Closed-End Funds, REITs, Americus Trusts, foreign stocks and American Depositary Receipts. Eligible companies with primary listings on the NYSE are ranked into equally populated deciles. The largest capitalizations in each decile serve as the breakpoints that are applied to various exchange groupings of the universe. Individual decile portfolios are created for each exchange group, the largest being in decile 1 and the smallest in decile 10. This index measures the combined performance of Deciles 0 - 5. | n/a | 06/30/1963 | 12/31/1978 | ||
| U.S. Micro-Cap | 0.600% | Wilshire US Micro-Cap IndexThe term Wilshire US Micro Cap Index refers to a composite that includes micro capitalization companies located in the United States. The Wilshire US Micro Cap is published and maintained by Wilshire Associates. | iShares Micro-Cap ETF (IWC) | 06/30/1963 | 05/31/2026 |
| NASDAQ Composite | 0.210% | NASDAQ Composite IndexThe Nasdaq Composite Index uses a market capitalization weighting methodology. The index's value equals the total value of the share weights of each of the constituent securities, multiplied by each security's last price.It seeks to provide investment returns that closely correspond to the price and yield performance of the Nasdaq Composite Index (Index). | n/a | 01/31/1971 | 05/31/2026 |
| S&P 500 IndexThe Standard and Poor's 500, or simply the S&P 500,[5] is a stock market index tracking the stock performance of 500 large companies listed on stock exchanges in the United States. It is one of the most commonly followed equity indices. As of December 31, 2020, more than $5.4 trillion was invested in assets tied to the performance of the index. | State Street SPDR S&P 500 ETF (SPY) | 06/30/1963 | 01/31/1971 | ||
| NASDAQ 100 | 0.180% | NASDAQ 100 IndexThe NASDAQ 100 Index Fund seeks to track the investment results, before fees and expenses, of the NASDAQ-100 Index® which includes 100 of the largest Nasdaq-listed non-financial companies. | Invesco QQQ Trust (QQQ) | 10/31/1985 | 05/31/2026 |
| NASDAQ Composite IndexThe Nasdaq Composite Index uses a market capitalization weighting methodology. The index's value equals the total value of the share weights of each of the constituent securities, multiplied by each security's last price.It seeks to provide investment returns that closely correspond to the price and yield performance of the Nasdaq Composite Index (Index). | n/a | 01/31/1971 | 10/31/1985 | ||
| S&P 500 IndexThe Standard and Poor's 500, or simply the S&P 500,[5] is a stock market index tracking the stock performance of 500 large companies listed on stock exchanges in the United States. It is one of the most commonly followed equity indices. As of December 31, 2020, more than $5.4 trillion was invested in assets tied to the performance of the index. | State Street SPDR S&P 500 ETF (SPY) | 06/30/1963 | 01/31/1971 | ||
| S&P 500 Growth | 0.040% | S&P 500 Growth IndexThe S&P 500 Growth Index is a stock index administered by Standard & Poor's-Dow Jones Indices. As its name suggests, the purpose of the index is to serve as a proxy for growth companies included in the S&P 500. The index identifies growth stocks using three factors: sales growth, the ratio of earnings change to price, and momentum. | n/a | 10/31/1985 | 05/31/2026 |
| S&P 500 IndexThe Standard and Poor's 500, or simply the S&P 500,[5] is a stock market index tracking the stock performance of 500 large companies listed on stock exchanges in the United States. It is one of the most commonly followed equity indices. As of December 31, 2020, more than $5.4 trillion was invested in assets tied to the performance of the index. | State Street SPDR S&P 500 ETF (SPY) | 06/30/1963 | 10/31/1985 | ||
| S&P 500 Value | 0.040% | S&P 500 Value IndexThe term S&P 500 Pure Value Index refers to a score-weighted index developed by Standard and Poor's (S&P). The index uses what it calls a "style-attractiveness-weighting scheme" and only consists of stocks within the S&P 500 Index that exhibit strong value characteristics. The index was launched in 2005 and consists of 120 constituents, the majority of which are financial services companies.The index was previously called the S&P 500/Citigroup Pure Value Index because of the relationship between Standard and Poor's, and Citigroup. | n/a | 10/31/1985 | 05/31/2026 |
| S&P 500 IndexThe Standard and Poor's 500, or simply the S&P 500,[5] is a stock market index tracking the stock performance of 500 large companies listed on stock exchanges in the United States. It is one of the most commonly followed equity indices. As of December 31, 2020, more than $5.4 trillion was invested in assets tied to the performance of the index. | State Street SPDR S&P 500 ETF (SPY) | 06/30/1963 | 10/31/1985 | ||
| S&P 400 Mid | 0.230% | S&P 400 IndexThe S&P MidCap 400 Index, more commonly known as the S&P 400, is a stock market index from S&P Dow Jones Indices. The index serves as a gauge for the U.S. mid-cap equities sector and is the most widely followed mid-cap index. | n/a | 10/31/1985 | 05/31/2026 |
| CRSP U.S. Stocks Deciles 6-8CRSP Cap-Based Portfolio Index data are a monthly series based on portfolios that are rebalanced quarterly. The methodology used to calculate the series differs from the CRSP Stock File Capitalization Decile Indexes.The universe includes all common stocks listed on the NYSE, NYSE MKT, and NASDAQ National Market excluding Unit Investment Trusts, Closed-End Funds, REITs, Americus Trusts, foreign stocks and American Depositary Receipts. Eligible companies with primary listings on the NYSE are ranked into equally populated deciles. The largest capitalizations in each decile serve as the breakpoints that are applied to various exchange groupings of the universe.Individual decile portfolios are created for each exchange group, the largest being in decile 1 and the smallest in decile 10. This index measures the combined performance of Deciles 6 - 8. | n/a | 06/30/1963 | 10/31/1985 | ||
| S&P 500 IndexThe Standard and Poor's 500, or simply the S&P 500,[5] is a stock market index tracking the stock performance of 500 large companies listed on stock exchanges in the United States. It is one of the most commonly followed equity indices. As of December 31, 2020, more than $5.4 trillion was invested in assets tied to the performance of the index. | State Street SPDR S&P 500 ETF (SPY) | 06/30/1963 | 06/30/1963 | ||
| U.S. All-Cap | 0.030% | CRSP U.S. Total Market IndexThe investment seeks to track the performance of the CRSP US Total Market Index that measures the investment return of the overall stock market.Nearly 4,000 constituents across mega, large, small and micro capitalizations, representing nearly 100% of the U.S. investable equity market, comprise the CRSP US Total Market Index. The total return index was first posted on the NASDAQ GIDSSM (Global Index Data ServiceSM) feed on December 31, 2012; the price return index was posted on January 18, 2011. | Vanguard Total Stock Market ETF (VTI) | 12/31/1985 | 05/31/2026 |
| S&P 500 IndexThe Standard and Poor's 500, or simply the S&P 500,[5] is a stock market index tracking the stock performance of 500 large companies listed on stock exchanges in the United States. It is one of the most commonly followed equity indices. As of December 31, 2020, more than $5.4 trillion was invested in assets tied to the performance of the index. | State Street SPDR S&P 500 ETF (SPY) | 06/30/1963 | 12/31/1985 | ||
| Intl Developed Countries | 0.030% | MSCI EAFE IndexThe MSCI EAFE Investable Market Index (IMI) is an equity index which captures large, mid and small cap companies and targets coverage of approximately 99% of the global equity opportunity set outside the US and Canada. The MSCI EAFE Index is an equity index which captures large and mid cap representation across 21 Developed Markets countries* around the world, excluding the US and Canada. The index is comprehensive, covering approximately 85% of the free float-adjusted market capitalization in each country."The MSCI EAFE Index is an equity index which captures large and mid cap representation across 21 Developed Markets countries*around the world, excluding the US and Canada. With 843 constituents, the index covers approximately 85% of the free float adjusted market capitalization in each country." | Vanguard FTSE Developed Markets ETF (VEA) | 12/31/1969 | 05/31/2026 |
| S&P 500 IndexThe Standard and Poor's 500, or simply the S&P 500,[5] is a stock market index tracking the stock performance of 500 large companies listed on stock exchanges in the United States. It is one of the most commonly followed equity indices. As of December 31, 2020, more than $5.4 trillion was invested in assets tied to the performance of the index. | State Street SPDR S&P 500 ETF (SPY) | 06/30/1963 | 12/31/1969 | ||
| Intl Core | 0.070% | MSCI ACWI ex USAThe MSCI ACWI ex USA Index captures large and mid cap representation across 22 of 23 Developed Markets (DM) countries (excluding the US) and 24 Emerging Markets (EM) countries*. With 2,271 constituents, the index covers approximately 85% of the global equity opportunity set outside the US. | iShares Core MSCI Total Intl Stk ETF (IXUS) | 10/31/2012 | 05/31/2026 |
| MSCI EAFE IndexThe MSCI EAFE Investable Market Index (IMI) is an equity index which captures large, mid and small cap companies and targets coverage of approximately 99% of the global equity opportunity set outside the US and Canada. The MSCI EAFE Index is an equity index which captures large and mid cap representation across 21 Developed Markets countries* around the world, excluding the US and Canada. The index is comprehensive, covering approximately 85% of the free float-adjusted market capitalization in each country."The MSCI EAFE Index is an equity index which captures large and mid cap representation across 21 Developed Markets countries*around the world, excluding the US and Canada. With 843 constituents, the index covers approximately 85% of the free float adjusted market capitalization in each country." | Vanguard FTSE Developed Markets ETF (VEA) | 12/31/1969 | 10/31/2012 | ||
| S&P 500 IndexThe Standard and Poor's 500, or simply the S&P 500,[5] is a stock market index tracking the stock performance of 500 large companies listed on stock exchanges in the United States. It is one of the most commonly followed equity indices. As of December 31, 2020, more than $5.4 trillion was invested in assets tied to the performance of the index. | State Street SPDR S&P 500 ETF (SPY) | 06/30/1963 | 12/31/1969 | ||
| Intl Growth | 0.340% | MSCI EAFE Growth IndexThe MSCI EAFE Growth Index captures large and mid cap securities exhibiting overall growth style characteristics acrossDeveloped Markets countries* around the world, excluding the US and Canada. The growth investment style characteristics forindex construction are defined using five variables: long-term forward EPS growth rate, short-term forward EPS growth rate,current internal growth rate and long-term historical EPS growth trend and long-term historical sales per share growth trend. | iShares MSCI EAFE Growth ETF (EFG) | 08/31/2005 | 05/31/2026 |
| MSCI EAFE IndexThe MSCI EAFE Investable Market Index (IMI) is an equity index which captures large, mid and small cap companies and targets coverage of approximately 99% of the global equity opportunity set outside the US and Canada. The MSCI EAFE Index is an equity index which captures large and mid cap representation across 21 Developed Markets countries* around the world, excluding the US and Canada. The index is comprehensive, covering approximately 85% of the free float-adjusted market capitalization in each country."The MSCI EAFE Index is an equity index which captures large and mid cap representation across 21 Developed Markets countries*around the world, excluding the US and Canada. With 843 constituents, the index covers approximately 85% of the free float adjusted market capitalization in each country." | Vanguard FTSE Developed Markets ETF (VEA) | 12/31/1969 | 08/31/2005 | ||
| S&P 500 IndexThe Standard and Poor's 500, or simply the S&P 500,[5] is a stock market index tracking the stock performance of 500 large companies listed on stock exchanges in the United States. It is one of the most commonly followed equity indices. As of December 31, 2020, more than $5.4 trillion was invested in assets tied to the performance of the index. | State Street SPDR S&P 500 ETF (SPY) | 06/30/1963 | 12/31/1969 | ||
| Intl Value | 0.310% | MSCI EAFE Value IndexThe MSCI EAFE Value Index captures large and mid cap securities exhibiting overall value style characteristics across Developed Markets countries* around the world, excluding the US and Canada. The value investment style characteristics for index construction are defined using three variables: book value to price, 12-month forward earnings to price and dividend yield. With 461 constituents, the index targets 50% coverage of the free float-adjusted market capitalization of the MSCI EAFE Index.The MSCI EAFE Value Index captures large and mid cap securities exhibiting overall value style characteristics across Developed Markets countries* around the world, excluding the US and Canada. The value investment style characteristics for index construction are defined using three variables: book value to price, 12-month forward earnings to price and dividend yield. | iShares MSCI EAFE Value ETF (EFV) | 08/31/2005 | 05/31/2026 |
| MSCI EAFE IndexThe MSCI EAFE Investable Market Index (IMI) is an equity index which captures large, mid and small cap companies and targets coverage of approximately 99% of the global equity opportunity set outside the US and Canada. The MSCI EAFE Index is an equity index which captures large and mid cap representation across 21 Developed Markets countries* around the world, excluding the US and Canada. The index is comprehensive, covering approximately 85% of the free float-adjusted market capitalization in each country."The MSCI EAFE Index is an equity index which captures large and mid cap representation across 21 Developed Markets countries*around the world, excluding the US and Canada. With 843 constituents, the index covers approximately 85% of the free float adjusted market capitalization in each country." | Vanguard FTSE Developed Markets ETF (VEA) | 12/31/1969 | 08/31/2005 | ||
| S&P 500 IndexThe Standard and Poor's 500, or simply the S&P 500,[5] is a stock market index tracking the stock performance of 500 large companies listed on stock exchanges in the United States. It is one of the most commonly followed equity indices. As of December 31, 2020, more than $5.4 trillion was invested in assets tied to the performance of the index. | State Street SPDR S&P 500 ETF (SPY) | 06/30/1963 | 12/31/1969 | ||
| Intl Developed Small-Cap | 0.400% | MSCI EAFE Small Cap IndexThe MSCI EAFE Small Cap Index is an equity index which captures small cap representation across Developed Markets countries* around the world, excluding the US and Canada. With 2,329 constituents, the index covers approximately 14% of the free floatadjusted market capitalization in each country."The MSCI EAFE Small Cap Index is an equity index which captures small cap representation across Developed Markets countries*around the world, excluding the US and Canada. With 2,387 constituents, the index covers approximately 14% of the free float adjusted market capitalization in each country." | iShares MSCI EAFE Small-Cap ETF (SCZ) | 12/31/1992 | 05/31/2026 |
| MSCI EAFE IndexThe MSCI EAFE Investable Market Index (IMI) is an equity index which captures large, mid and small cap companies and targets coverage of approximately 99% of the global equity opportunity set outside the US and Canada. The MSCI EAFE Index is an equity index which captures large and mid cap representation across 21 Developed Markets countries* around the world, excluding the US and Canada. The index is comprehensive, covering approximately 85% of the free float-adjusted market capitalization in each country."The MSCI EAFE Index is an equity index which captures large and mid cap representation across 21 Developed Markets countries*around the world, excluding the US and Canada. With 843 constituents, the index covers approximately 85% of the free float adjusted market capitalization in each country." | Vanguard FTSE Developed Markets ETF (VEA) | 12/31/1969 | 12/31/1992 | ||
| S&P 500 IndexThe Standard and Poor's 500, or simply the S&P 500,[5] is a stock market index tracking the stock performance of 500 large companies listed on stock exchanges in the United States. It is one of the most commonly followed equity indices. As of December 31, 2020, more than $5.4 trillion was invested in assets tied to the performance of the index. | State Street SPDR S&P 500 ETF (SPY) | 06/30/1963 | 12/31/1969 | ||
| Intl Emerging Countries | 0.060% | FTSE Emerging Markets All Cap China A InclusionThe FTSE Emerging Markets All Cap China A Inclusion Index is a market-capitalisation weighted index representing the performance of large, mid and small cap stocks in Emerging markets. The index is part of the FTSE China A Inclusion Indexes which contain FTSE China A All Cap Index securities adjusted for the aggregate approved QFII and RQFII quotas available to international investors. | Vanguard FTSE Emerging Markets ETF (VWO) | 12/31/1987 | 05/31/2026 |
| MSCI EAFE IndexThe MSCI EAFE Investable Market Index (IMI) is an equity index which captures large, mid and small cap companies and targets coverage of approximately 99% of the global equity opportunity set outside the US and Canada. The MSCI EAFE Index is an equity index which captures large and mid cap representation across 21 Developed Markets countries* around the world, excluding the US and Canada. The index is comprehensive, covering approximately 85% of the free float-adjusted market capitalization in each country."The MSCI EAFE Index is an equity index which captures large and mid cap representation across 21 Developed Markets countries*around the world, excluding the US and Canada. With 843 constituents, the index covers approximately 85% of the free float adjusted market capitalization in each country." | Vanguard FTSE Developed Markets ETF (VEA) | 12/31/1969 | 12/31/1987 | ||
| S&P 500 IndexThe Standard and Poor's 500, or simply the S&P 500,[5] is a stock market index tracking the stock performance of 500 large companies listed on stock exchanges in the United States. It is one of the most commonly followed equity indices. As of December 31, 2020, more than $5.4 trillion was invested in assets tied to the performance of the index. | State Street SPDR S&P 500 ETF (SPY) | 06/30/1963 | 12/31/1969 | ||
| Intl Emerging Small-Cap | 0.650% | S&P Emerging Markets Under USD2 Billion IndexThe S&P Emerging Under USD2 Billion is a float-adjusted market capitalization weighted index including all stocks with total market capitalization less than USD 2 Billion from emerging countries included in the S&P Emerging BMI. | State Street SPDR S&P EM Sm Cp ETF (EWX) | 05/31/2008 | 05/31/2026 |
| FTSE Emerging Markets All Cap China A InclusionThe FTSE Emerging Markets All Cap China A Inclusion Index is a market-capitalisation weighted index representing the performance of large, mid and small cap stocks in Emerging markets. The index is part of the FTSE China A Inclusion Indexes which contain FTSE China A All Cap Index securities adjusted for the aggregate approved QFII and RQFII quotas available to international investors. | Vanguard FTSE Emerging Markets ETF (VWO) | 12/31/1987 | 05/31/2008 | ||
| S&P 500 IndexThe Standard and Poor's 500, or simply the S&P 500,[5] is a stock market index tracking the stock performance of 500 large companies listed on stock exchanges in the United States. It is one of the most commonly followed equity indices. As of December 31, 2020, more than $5.4 trillion was invested in assets tied to the performance of the index. | State Street SPDR S&P 500 ETF (SPY) | 06/30/1963 | 12/31/1987 | ||
| Total World | 0.060% | FTSE Global All Cap IndexThe FTSE Global All Cap Index is a market-capitalisation weighted index representing the performance of the large, mid and small cap stocks globally. | Vanguard Total World Stock ETF (VT) | 06/30/2008 | 05/31/2026 |
| MSCI EAFE IndexThe MSCI EAFE Investable Market Index (IMI) is an equity index which captures large, mid and small cap companies and targets coverage of approximately 99% of the global equity opportunity set outside the US and Canada. The MSCI EAFE Index is an equity index which captures large and mid cap representation across 21 Developed Markets countries* around the world, excluding the US and Canada. The index is comprehensive, covering approximately 85% of the free float-adjusted market capitalization in each country."The MSCI EAFE Index is an equity index which captures large and mid cap representation across 21 Developed Markets countries*around the world, excluding the US and Canada. With 843 constituents, the index covers approximately 85% of the free float adjusted market capitalization in each country." | Vanguard FTSE Developed Markets ETF (VEA) | 12/31/1969 | 06/30/2008 | ||
| S&P 500 IndexThe Standard and Poor's 500, or simply the S&P 500,[5] is a stock market index tracking the stock performance of 500 large companies listed on stock exchanges in the United States. It is one of the most commonly followed equity indices. As of December 31, 2020, more than $5.4 trillion was invested in assets tied to the performance of the index. | State Street SPDR S&P 500 ETF (SPY) | 06/30/1963 | 12/31/1969 | ||
| Region - Eurozone | 0.500% | MSCI EMUThe MSCI EMU Index (European Economic and Monetary Union) captures large and mid cap representation across the 10 Developed Markets countries in the EMU*. With 230 constituents, the index covers approximately 85% of the free float-adjusted market capitalization of the EMU.The MSCI EMU Index (European Economic and Monetary Union) captures large and mid cap representation across the 10 Developed Markets countries in the EMU*. With 233 constituents, the index covers approximately 85% of the free float-adjusted market capitalization of the EMU. | iShares MSCI Eurozone ETF (EZU) | 07/31/2000 | 05/31/2026 |
| MSCI EAFE IndexThe MSCI EAFE Investable Market Index (IMI) is an equity index which captures large, mid and small cap companies and targets coverage of approximately 99% of the global equity opportunity set outside the US and Canada. The MSCI EAFE Index is an equity index which captures large and mid cap representation across 21 Developed Markets countries* around the world, excluding the US and Canada. The index is comprehensive, covering approximately 85% of the free float-adjusted market capitalization in each country."The MSCI EAFE Index is an equity index which captures large and mid cap representation across 21 Developed Markets countries*around the world, excluding the US and Canada. With 843 constituents, the index covers approximately 85% of the free float adjusted market capitalization in each country." | Vanguard FTSE Developed Markets ETF (VEA) | 12/31/1969 | 07/31/2000 | ||
| S&P 500 IndexThe Standard and Poor's 500, or simply the S&P 500,[5] is a stock market index tracking the stock performance of 500 large companies listed on stock exchanges in the United States. It is one of the most commonly followed equity indices. As of December 31, 2020, more than $5.4 trillion was invested in assets tied to the performance of the index. | State Street SPDR S&P 500 ETF (SPY) | 06/30/1963 | 12/31/1969 | ||
| Region - Asia | 0.490% | MSCI AC Asia | State Street SPDR S&P Em AsiaPac ETF (GMF) | 03/31/2007 | 05/31/2026 |
| FTSE Emerging Markets All Cap China A InclusionThe FTSE Emerging Markets All Cap China A Inclusion Index is a market-capitalisation weighted index representing the performance of large, mid and small cap stocks in Emerging markets. The index is part of the FTSE China A Inclusion Indexes which contain FTSE China A All Cap Index securities adjusted for the aggregate approved QFII and RQFII quotas available to international investors. | Vanguard FTSE Emerging Markets ETF (VWO) | 12/31/1987 | 03/31/2007 | ||
| MSCI EAFE IndexThe MSCI EAFE Investable Market Index (IMI) is an equity index which captures large, mid and small cap companies and targets coverage of approximately 99% of the global equity opportunity set outside the US and Canada. The MSCI EAFE Index is an equity index which captures large and mid cap representation across 21 Developed Markets countries* around the world, excluding the US and Canada. The index is comprehensive, covering approximately 85% of the free float-adjusted market capitalization in each country."The MSCI EAFE Index is an equity index which captures large and mid cap representation across 21 Developed Markets countries*around the world, excluding the US and Canada. With 843 constituents, the index covers approximately 85% of the free float adjusted market capitalization in each country." | Vanguard FTSE Developed Markets ETF (VEA) | 12/31/1969 | 12/31/1987 | ||
| Country - Australia | 0.500% | MSCI AustraliaThe MSCI Australia Index is designed to measure the performance of the large and mid cap segments of the Australia market. With 66 constituents, the index covers approximately 85% of the free float-adjusted market capitalization in Australia. | iShares MSCI Australia ETF (EWA) | 03/31/1996 | 05/31/2026 |
| MSCI EAFE IndexThe MSCI EAFE Investable Market Index (IMI) is an equity index which captures large, mid and small cap companies and targets coverage of approximately 99% of the global equity opportunity set outside the US and Canada. The MSCI EAFE Index is an equity index which captures large and mid cap representation across 21 Developed Markets countries* around the world, excluding the US and Canada. The index is comprehensive, covering approximately 85% of the free float-adjusted market capitalization in each country."The MSCI EAFE Index is an equity index which captures large and mid cap representation across 21 Developed Markets countries*around the world, excluding the US and Canada. With 843 constituents, the index covers approximately 85% of the free float adjusted market capitalization in each country." | Vanguard FTSE Developed Markets ETF (VEA) | 12/31/1969 | 03/31/1996 | ||
| S&P 500 IndexThe Standard and Poor's 500, or simply the S&P 500,[5] is a stock market index tracking the stock performance of 500 large companies listed on stock exchanges in the United States. It is one of the most commonly followed equity indices. As of December 31, 2020, more than $5.4 trillion was invested in assets tied to the performance of the index. | State Street SPDR S&P 500 ETF (SPY) | 06/30/1963 | 12/31/1969 | ||
| Country - Germany | 0.490% | MSCI GermanyThe MSCI Germany Index is designed to measure the performance of the large and mid cap segments of the German market. With 60 constituents, the index covers about 85% of the equity universe in Germany. | iShares MSCI Germany ETF (EWG) | 03/31/1996 | 05/31/2026 |
| MSCI EAFE IndexThe MSCI EAFE Investable Market Index (IMI) is an equity index which captures large, mid and small cap companies and targets coverage of approximately 99% of the global equity opportunity set outside the US and Canada. The MSCI EAFE Index is an equity index which captures large and mid cap representation across 21 Developed Markets countries* around the world, excluding the US and Canada. The index is comprehensive, covering approximately 85% of the free float-adjusted market capitalization in each country."The MSCI EAFE Index is an equity index which captures large and mid cap representation across 21 Developed Markets countries*around the world, excluding the US and Canada. With 843 constituents, the index covers approximately 85% of the free float adjusted market capitalization in each country." | Vanguard FTSE Developed Markets ETF (VEA) | 12/31/1969 | 03/31/1996 | ||
| S&P 500 IndexThe Standard and Poor's 500, or simply the S&P 500,[5] is a stock market index tracking the stock performance of 500 large companies listed on stock exchanges in the United States. It is one of the most commonly followed equity indices. As of December 31, 2020, more than $5.4 trillion was invested in assets tied to the performance of the index. | State Street SPDR S&P 500 ETF (SPY) | 06/30/1963 | 12/31/1969 | ||
| Country - France | 0.500% | MSCI FranceThe MSCI France Index is designed to measure the performance of the large and mid cap segments of the French market. With 65 constituents, the index covers about 85% of the equity universe in France. | iShares MSCI France ETF (EWQ) | 03/31/1996 | 05/31/2026 |
| MSCI EAFE IndexThe MSCI EAFE Investable Market Index (IMI) is an equity index which captures large, mid and small cap companies and targets coverage of approximately 99% of the global equity opportunity set outside the US and Canada. The MSCI EAFE Index is an equity index which captures large and mid cap representation across 21 Developed Markets countries* around the world, excluding the US and Canada. The index is comprehensive, covering approximately 85% of the free float-adjusted market capitalization in each country."The MSCI EAFE Index is an equity index which captures large and mid cap representation across 21 Developed Markets countries*around the world, excluding the US and Canada. With 843 constituents, the index covers approximately 85% of the free float adjusted market capitalization in each country." | Vanguard FTSE Developed Markets ETF (VEA) | 12/31/1969 | 03/31/1996 | ||
| S&P 500 IndexThe Standard and Poor's 500, or simply the S&P 500,[5] is a stock market index tracking the stock performance of 500 large companies listed on stock exchanges in the United States. It is one of the most commonly followed equity indices. As of December 31, 2020, more than $5.4 trillion was invested in assets tied to the performance of the index. | State Street SPDR S&P 500 ETF (SPY) | 06/30/1963 | 12/31/1969 | ||
| Country - United Kingdom | 0.500% | MSCI United KingdomThe MSCI United Kingdom Index is designed to measure the performance of the large and mid cap segments of the UK market. With 82 constituents, the index covers approximately 85% of the free float-adjusted market capitalization in the UK. | iShares MSCI United Kingdom ETF (EWU) | 03/31/1996 | 05/31/2026 |
| MSCI EAFE IndexThe MSCI EAFE Investable Market Index (IMI) is an equity index which captures large, mid and small cap companies and targets coverage of approximately 99% of the global equity opportunity set outside the US and Canada. The MSCI EAFE Index is an equity index which captures large and mid cap representation across 21 Developed Markets countries* around the world, excluding the US and Canada. The index is comprehensive, covering approximately 85% of the free float-adjusted market capitalization in each country."The MSCI EAFE Index is an equity index which captures large and mid cap representation across 21 Developed Markets countries*around the world, excluding the US and Canada. With 843 constituents, the index covers approximately 85% of the free float adjusted market capitalization in each country." | Vanguard FTSE Developed Markets ETF (VEA) | 12/31/1969 | 03/31/1996 | ||
| S&P 500 IndexThe Standard and Poor's 500, or simply the S&P 500,[5] is a stock market index tracking the stock performance of 500 large companies listed on stock exchanges in the United States. It is one of the most commonly followed equity indices. As of December 31, 2020, more than $5.4 trillion was invested in assets tied to the performance of the index. | State Street SPDR S&P 500 ETF (SPY) | 06/30/1963 | 12/31/1969 | ||
| Country - Italy | 0.500% | MSCI Italy 25/50The MSCI Italy 25/50 Index is designed to measure the performance of the large and mid cap segments of the Italian market. It applies certain investment limits that are imposed on regulated investment companies, or RICs, under the current US Internal Revenue Code. With 24 constituents, the index covers approximately 85% of the free float-adjusted market capitalization in Italy.The MSCI Italy 25/50 Index is designed to measure the performance of the large and mid cap segments of the Italian market. It applies certain investment limits that are imposed on regulated investment companies, or RICs, under the current US Internal Revenue Code. With 26 constituents, the index covers approximately 85% of the free float-adjusted market capitalization in Italy. | iShares MSCI Italy ETF (EWI) | 03/31/1996 | 05/31/2026 |
| MSCI EAFE IndexThe MSCI EAFE Investable Market Index (IMI) is an equity index which captures large, mid and small cap companies and targets coverage of approximately 99% of the global equity opportunity set outside the US and Canada. The MSCI EAFE Index is an equity index which captures large and mid cap representation across 21 Developed Markets countries* around the world, excluding the US and Canada. The index is comprehensive, covering approximately 85% of the free float-adjusted market capitalization in each country."The MSCI EAFE Index is an equity index which captures large and mid cap representation across 21 Developed Markets countries*around the world, excluding the US and Canada. With 843 constituents, the index covers approximately 85% of the free float adjusted market capitalization in each country." | Vanguard FTSE Developed Markets ETF (VEA) | 12/31/1969 | 03/31/1996 | ||
| S&P 500 IndexThe Standard and Poor's 500, or simply the S&P 500,[5] is a stock market index tracking the stock performance of 500 large companies listed on stock exchanges in the United States. It is one of the most commonly followed equity indices. As of December 31, 2020, more than $5.4 trillion was invested in assets tied to the performance of the index. | State Street SPDR S&P 500 ETF (SPY) | 06/30/1963 | 12/31/1969 | ||
| Country - Spain | 0.500% | MSCI Spain 25/50The MSCI Spain 25/50 Index is designed to measure the performance of the large and mid cap segments of the Spanish market. It applies certain investment limits that are imposed on regulated investment companies, or RICs, under the current US Internal Revenue Code. With 19 constituents,the index covers approximately 85% ofthe free float-adjusted market capitalization in Spain. | iShares MSCI Spain ETF (EWP) | 03/31/1996 | 05/31/2026 |
| MSCI EAFE IndexThe MSCI EAFE Investable Market Index (IMI) is an equity index which captures large, mid and small cap companies and targets coverage of approximately 99% of the global equity opportunity set outside the US and Canada. The MSCI EAFE Index is an equity index which captures large and mid cap representation across 21 Developed Markets countries* around the world, excluding the US and Canada. The index is comprehensive, covering approximately 85% of the free float-adjusted market capitalization in each country."The MSCI EAFE Index is an equity index which captures large and mid cap representation across 21 Developed Markets countries*around the world, excluding the US and Canada. With 843 constituents, the index covers approximately 85% of the free float adjusted market capitalization in each country." | Vanguard FTSE Developed Markets ETF (VEA) | 12/31/1969 | 03/31/1996 | ||
| S&P 500 IndexThe Standard and Poor's 500, or simply the S&P 500,[5] is a stock market index tracking the stock performance of 500 large companies listed on stock exchanges in the United States. It is one of the most commonly followed equity indices. As of December 31, 2020, more than $5.4 trillion was invested in assets tied to the performance of the index. | State Street SPDR S&P 500 ETF (SPY) | 06/30/1963 | 12/31/1969 | ||
| Country - China | 0.730% | FTSE China 50 IndexThe FTSE China 50 Index is designed to represent the performance of Chinese companies that are listed on the Hong Kong Stock Exchange. H Shares, P Chips and Red Chips are eligible for inclusion in the FTSE China 50 Index. Other China share classes are ineligible | iShares China Large-Cap ETF (FXI) | 10/31/2004 | 05/31/2026 |
| FTSE Emerging Markets All Cap China A InclusionThe FTSE Emerging Markets All Cap China A Inclusion Index is a market-capitalisation weighted index representing the performance of large, mid and small cap stocks in Emerging markets. The index is part of the FTSE China A Inclusion Indexes which contain FTSE China A All Cap Index securities adjusted for the aggregate approved QFII and RQFII quotas available to international investors. | Vanguard FTSE Emerging Markets ETF (VWO) | 12/31/1987 | 10/31/2004 | ||
| MSCI EAFE IndexThe MSCI EAFE Investable Market Index (IMI) is an equity index which captures large, mid and small cap companies and targets coverage of approximately 99% of the global equity opportunity set outside the US and Canada. The MSCI EAFE Index is an equity index which captures large and mid cap representation across 21 Developed Markets countries* around the world, excluding the US and Canada. The index is comprehensive, covering approximately 85% of the free float-adjusted market capitalization in each country."The MSCI EAFE Index is an equity index which captures large and mid cap representation across 21 Developed Markets countries*around the world, excluding the US and Canada. With 843 constituents, the index covers approximately 85% of the free float adjusted market capitalization in each country." | Vanguard FTSE Developed Markets ETF (VEA) | 12/31/1969 | 12/31/1987 | ||
| Country - Hong Kong | 0.500% | MSCI Hong Kong 25/50The MSCI Hong Kong 25/50 Index is designed to measure the performance of the large and mid cap segments of the Hong Kong market. It applies certain investment limits that are imposed on regulated investment companies, or RICs, under the current US Internal Revenue Code. With 34 constituents, the index covers approximately 85% of the free float-adjusted market capitalization in Hong Kong.The MSCI Hong Kong 25/50 Index is designed to measure the performance of the large and mid cap segments of the Hong Kong market. It applies certain investment limits that are imposed on regulated investment companies, or RICs, under the current US Internal Revenue Code. With 37 constituents, the index covers approximately 85% of the free float-adjusted market capitalization in Hong Kong. | iShares MSCI Hong Kong ETF (EWH) | 03/31/1996 | 05/31/2026 |
| FTSE Emerging Markets All Cap China A InclusionThe FTSE Emerging Markets All Cap China A Inclusion Index is a market-capitalisation weighted index representing the performance of large, mid and small cap stocks in Emerging markets. The index is part of the FTSE China A Inclusion Indexes which contain FTSE China A All Cap Index securities adjusted for the aggregate approved QFII and RQFII quotas available to international investors. | Vanguard FTSE Emerging Markets ETF (VWO) | 12/31/1987 | 03/31/1996 | ||
| MSCI EAFE IndexThe MSCI EAFE Investable Market Index (IMI) is an equity index which captures large, mid and small cap companies and targets coverage of approximately 99% of the global equity opportunity set outside the US and Canada. The MSCI EAFE Index is an equity index which captures large and mid cap representation across 21 Developed Markets countries* around the world, excluding the US and Canada. The index is comprehensive, covering approximately 85% of the free float-adjusted market capitalization in each country."The MSCI EAFE Index is an equity index which captures large and mid cap representation across 21 Developed Markets countries*around the world, excluding the US and Canada. With 843 constituents, the index covers approximately 85% of the free float adjusted market capitalization in each country." | Vanguard FTSE Developed Markets ETF (VEA) | 12/31/1969 | 12/31/1987 | ||
| Country - South Korea | 0.590% | MSCI Korea 25/50The MSCI Korea 25/50 Index is designed to measure the performance of the large and mid cap segments of the Korean market. It applies certain investment limits that are imposed on regulated investment companies, or RICs, under the current US Internal Revenue Code. With 111 constituents, the index covers approximately 85% of the free float-adjusted market capitalization in Korea. | iShares MSCI South Korea ETF (EWY) | 05/31/2000 | 05/31/2026 |
| FTSE Emerging Markets All Cap China A InclusionThe FTSE Emerging Markets All Cap China A Inclusion Index is a market-capitalisation weighted index representing the performance of large, mid and small cap stocks in Emerging markets. The index is part of the FTSE China A Inclusion Indexes which contain FTSE China A All Cap Index securities adjusted for the aggregate approved QFII and RQFII quotas available to international investors. | Vanguard FTSE Emerging Markets ETF (VWO) | 12/31/1987 | 05/31/2000 | ||
| MSCI EAFE IndexThe MSCI EAFE Investable Market Index (IMI) is an equity index which captures large, mid and small cap companies and targets coverage of approximately 99% of the global equity opportunity set outside the US and Canada. The MSCI EAFE Index is an equity index which captures large and mid cap representation across 21 Developed Markets countries* around the world, excluding the US and Canada. The index is comprehensive, covering approximately 85% of the free float-adjusted market capitalization in each country."The MSCI EAFE Index is an equity index which captures large and mid cap representation across 21 Developed Markets countries*around the world, excluding the US and Canada. With 843 constituents, the index covers approximately 85% of the free float adjusted market capitalization in each country." | Vanguard FTSE Developed Markets ETF (VEA) | 12/31/1969 | 12/31/1987 | ||
| Country - India | 0.780% | MSCI India NR USD | Invesco India ETF (PIN) | 03/31/2008 | 05/31/2026 |
| FTSE Emerging Markets All Cap China A InclusionThe FTSE Emerging Markets All Cap China A Inclusion Index is a market-capitalisation weighted index representing the performance of large, mid and small cap stocks in Emerging markets. The index is part of the FTSE China A Inclusion Indexes which contain FTSE China A All Cap Index securities adjusted for the aggregate approved QFII and RQFII quotas available to international investors. | Vanguard FTSE Emerging Markets ETF (VWO) | 12/31/1987 | 03/31/2008 | ||
| MSCI EAFE IndexThe MSCI EAFE Investable Market Index (IMI) is an equity index which captures large, mid and small cap companies and targets coverage of approximately 99% of the global equity opportunity set outside the US and Canada. The MSCI EAFE Index is an equity index which captures large and mid cap representation across 21 Developed Markets countries* around the world, excluding the US and Canada. The index is comprehensive, covering approximately 85% of the free float-adjusted market capitalization in each country."The MSCI EAFE Index is an equity index which captures large and mid cap representation across 21 Developed Markets countries*around the world, excluding the US and Canada. With 843 constituents, the index covers approximately 85% of the free float adjusted market capitalization in each country." | Vanguard FTSE Developed Markets ETF (VEA) | 12/31/1969 | 12/31/1987 | ||
| Country - Japan | 0.490% | MSCI JapanThe MSCI Japan Index is designed to measure the performance of the large and mid cap segments of the Japanese market. With 238 constituents, the index covers approximately 85% of the free float-adjusted market capitalization in Japan. | iShares MSCI Japan ETF (EWJ) | 03/31/1996 | 05/31/2026 |
| MSCI EAFE IndexThe MSCI EAFE Investable Market Index (IMI) is an equity index which captures large, mid and small cap companies and targets coverage of approximately 99% of the global equity opportunity set outside the US and Canada. The MSCI EAFE Index is an equity index which captures large and mid cap representation across 21 Developed Markets countries* around the world, excluding the US and Canada. The index is comprehensive, covering approximately 85% of the free float-adjusted market capitalization in each country."The MSCI EAFE Index is an equity index which captures large and mid cap representation across 21 Developed Markets countries*around the world, excluding the US and Canada. With 843 constituents, the index covers approximately 85% of the free float adjusted market capitalization in each country." | Vanguard FTSE Developed Markets ETF (VEA) | 12/31/1969 | 03/31/1996 | ||
| S&P 500 IndexThe Standard and Poor's 500, or simply the S&P 500,[5] is a stock market index tracking the stock performance of 500 large companies listed on stock exchanges in the United States. It is one of the most commonly followed equity indices. As of December 31, 2020, more than $5.4 trillion was invested in assets tied to the performance of the index. | State Street SPDR S&P 500 ETF (SPY) | 06/30/1963 | 12/31/1969 | ||
| Country - Brazil | 0.590% | MSCI Brazil 25/50The MSCI Brazil 25/50 Index is designed to measure the performance of the large and mid cap segments of the Brazilian market. It applies certain investment limits that are imposed on regulated investment companies, or RICs, under the current US Internal Revenue Code. With 48 constituents, the index covers approximately 85% of the free float-adjusted market capitalization in Brazil.The MSCI Brazil 25/50 Index is designed to measure the performance of the large and mid cap segments of the Brazilian market. It applies certain investment limits that are imposed on regulated investment companies, or RICs, under the current US Internal Revenue Code. With 53 constituents, the index covers approximately 85% of the free float-adjusted market capitalization in Brazil. | iShares MSCI Brazil ETF (EWZ) | 07/31/2000 | 05/31/2026 |
| FTSE Emerging Markets All Cap China A InclusionThe FTSE Emerging Markets All Cap China A Inclusion Index is a market-capitalisation weighted index representing the performance of large, mid and small cap stocks in Emerging markets. The index is part of the FTSE China A Inclusion Indexes which contain FTSE China A All Cap Index securities adjusted for the aggregate approved QFII and RQFII quotas available to international investors. | Vanguard FTSE Emerging Markets ETF (VWO) | 12/31/1987 | 07/31/2000 | ||
| MSCI EAFE IndexThe MSCI EAFE Investable Market Index (IMI) is an equity index which captures large, mid and small cap companies and targets coverage of approximately 99% of the global equity opportunity set outside the US and Canada. The MSCI EAFE Index is an equity index which captures large and mid cap representation across 21 Developed Markets countries* around the world, excluding the US and Canada. The index is comprehensive, covering approximately 85% of the free float-adjusted market capitalization in each country."The MSCI EAFE Index is an equity index which captures large and mid cap representation across 21 Developed Markets countries*around the world, excluding the US and Canada. With 843 constituents, the index covers approximately 85% of the free float adjusted market capitalization in each country." | Vanguard FTSE Developed Markets ETF (VEA) | 12/31/1969 | 12/31/1987 | ||
| Country - Turkey | 0.590% | MSCI Turkey IMI 25/50The MSCI Turkey IMI 25/50 Index is designed to measure the performance of the large, mid and small cap segments of the Turkish equity market. It applies certain investment limits that are imposed on regulated investment companies, or RICs, under the current US Internal Revenue Code. With 46 constituents, the index covers approximately 99% ofthe free float-adjusted market capitalization in Turkey. | iShares MSCI Turkey ETF (TUR) | 03/31/2008 | 05/31/2026 |
| FTSE Emerging Markets All Cap China A InclusionThe FTSE Emerging Markets All Cap China A Inclusion Index is a market-capitalisation weighted index representing the performance of large, mid and small cap stocks in Emerging markets. The index is part of the FTSE China A Inclusion Indexes which contain FTSE China A All Cap Index securities adjusted for the aggregate approved QFII and RQFII quotas available to international investors. | Vanguard FTSE Emerging Markets ETF (VWO) | 12/31/1987 | 03/31/2008 | ||
| MSCI EAFE IndexThe MSCI EAFE Investable Market Index (IMI) is an equity index which captures large, mid and small cap companies and targets coverage of approximately 99% of the global equity opportunity set outside the US and Canada. The MSCI EAFE Index is an equity index which captures large and mid cap representation across 21 Developed Markets countries* around the world, excluding the US and Canada. The index is comprehensive, covering approximately 85% of the free float-adjusted market capitalization in each country."The MSCI EAFE Index is an equity index which captures large and mid cap representation across 21 Developed Markets countries*around the world, excluding the US and Canada. With 843 constituents, the index covers approximately 85% of the free float adjusted market capitalization in each country." | Vanguard FTSE Developed Markets ETF (VEA) | 12/31/1969 | 12/31/1987 | ||
| Country - Taiwan | 0.590% | MSCI Taiwan 25/50The MSCI Taiwan 25/50 Index is designed to measure the performance of the large and mid cap segments of the Taiwanese market. It applies certain investment limits that are imposed on regulated investment companies, or RICs, under the current US Internal Revenue Code. With 87 constituents, the index covers approximately 85% of the free float-adjusted market capitalization in Taiwan. | iShares MSCI Taiwan ETF (EWT) | 06/30/2000 | 05/31/2026 |
| FTSE Emerging Markets All Cap China A InclusionThe FTSE Emerging Markets All Cap China A Inclusion Index is a market-capitalisation weighted index representing the performance of large, mid and small cap stocks in Emerging markets. The index is part of the FTSE China A Inclusion Indexes which contain FTSE China A All Cap Index securities adjusted for the aggregate approved QFII and RQFII quotas available to international investors. | Vanguard FTSE Emerging Markets ETF (VWO) | 12/31/1987 | 06/30/2000 | ||
| MSCI EAFE IndexThe MSCI EAFE Investable Market Index (IMI) is an equity index which captures large, mid and small cap companies and targets coverage of approximately 99% of the global equity opportunity set outside the US and Canada. The MSCI EAFE Index is an equity index which captures large and mid cap representation across 21 Developed Markets countries* around the world, excluding the US and Canada. The index is comprehensive, covering approximately 85% of the free float-adjusted market capitalization in each country."The MSCI EAFE Index is an equity index which captures large and mid cap representation across 21 Developed Markets countries*around the world, excluding the US and Canada. With 843 constituents, the index covers approximately 85% of the free float adjusted market capitalization in each country." | Vanguard FTSE Developed Markets ETF (VEA) | 12/31/1969 | 12/31/1987 | ||
| Country - Mexico | 0.500% | MSCI Mexico IMI 25/50The MSCI Mexico IMI 25/50 Index is designed to measure the performance of the large, mid and small cap segments of the Mexican market. It applies certain investment limits that are imposed on regulated investment companies, or RICs, under the current US Internal Revenue Code. With 44 constituents, the index covers approximately 99% of the free float-adjusted market capitalization in Mexico. | iShares MSCI Mexico ETF (EWW) | 03/31/1996 | 05/31/2026 |
| FTSE Emerging Markets All Cap China A InclusionThe FTSE Emerging Markets All Cap China A Inclusion Index is a market-capitalisation weighted index representing the performance of large, mid and small cap stocks in Emerging markets. The index is part of the FTSE China A Inclusion Indexes which contain FTSE China A All Cap Index securities adjusted for the aggregate approved QFII and RQFII quotas available to international investors. | Vanguard FTSE Emerging Markets ETF (VWO) | 12/31/1987 | 03/31/1996 | ||
| MSCI EAFE IndexThe MSCI EAFE Investable Market Index (IMI) is an equity index which captures large, mid and small cap companies and targets coverage of approximately 99% of the global equity opportunity set outside the US and Canada. The MSCI EAFE Index is an equity index which captures large and mid cap representation across 21 Developed Markets countries* around the world, excluding the US and Canada. The index is comprehensive, covering approximately 85% of the free float-adjusted market capitalization in each country."The MSCI EAFE Index is an equity index which captures large and mid cap representation across 21 Developed Markets countries*around the world, excluding the US and Canada. With 843 constituents, the index covers approximately 85% of the free float adjusted market capitalization in each country." | Vanguard FTSE Developed Markets ETF (VEA) | 12/31/1969 | 12/31/1987 | ||
| Country - Thailand | 0.590% | MSCI Thailand IMI 25/50The MSCI Thailand IMI 25/50 Index is designed to measure the performance of the large, mid and small cap segments of the Thailand market. It applies certain investment limits that are imposed on regulated investment companies, or RICs, under the current US Internal Revenue Code. With 133 constituents, the index covers approximately 99% of the free float-adjusted market capitalization in Thailand. | iShares MSCI Thailand ETF (THD) | 03/31/2008 | 05/31/2026 |
| FTSE Emerging Markets All Cap China A InclusionThe FTSE Emerging Markets All Cap China A Inclusion Index is a market-capitalisation weighted index representing the performance of large, mid and small cap stocks in Emerging markets. The index is part of the FTSE China A Inclusion Indexes which contain FTSE China A All Cap Index securities adjusted for the aggregate approved QFII and RQFII quotas available to international investors. | Vanguard FTSE Emerging Markets ETF (VWO) | 12/31/1987 | 03/31/2008 | ||
| MSCI EAFE IndexThe MSCI EAFE Investable Market Index (IMI) is an equity index which captures large, mid and small cap companies and targets coverage of approximately 99% of the global equity opportunity set outside the US and Canada. The MSCI EAFE Index is an equity index which captures large and mid cap representation across 21 Developed Markets countries* around the world, excluding the US and Canada. The index is comprehensive, covering approximately 85% of the free float-adjusted market capitalization in each country."The MSCI EAFE Index is an equity index which captures large and mid cap representation across 21 Developed Markets countries*around the world, excluding the US and Canada. With 843 constituents, the index covers approximately 85% of the free float adjusted market capitalization in each country." | Vanguard FTSE Developed Markets ETF (VEA) | 12/31/1969 | 12/31/1987 | ||
| Country - South Africa | 0.590% | MSCI South Africa 25/50The MSCI South Africa 25/50 Index is designed to measure the performance of the large and mid cap segments of the South African market. It applies certain investment limits that are imposed on regulated investment companies, or RICs, under the current US Internal Revenue Code. With 37 constituents, the index covers approximately 85% of the free float-adjusted market capitalization in South Africa. | iShares MSCI South Africa ETF (EZA) | 02/28/2003 | 05/31/2026 |
| FTSE Emerging Markets All Cap China A InclusionThe FTSE Emerging Markets All Cap China A Inclusion Index is a market-capitalisation weighted index representing the performance of large, mid and small cap stocks in Emerging markets. The index is part of the FTSE China A Inclusion Indexes which contain FTSE China A All Cap Index securities adjusted for the aggregate approved QFII and RQFII quotas available to international investors. | Vanguard FTSE Emerging Markets ETF (VWO) | 12/31/1987 | 02/28/2003 | ||
| MSCI EAFE IndexThe MSCI EAFE Investable Market Index (IMI) is an equity index which captures large, mid and small cap companies and targets coverage of approximately 99% of the global equity opportunity set outside the US and Canada. The MSCI EAFE Index is an equity index which captures large and mid cap representation across 21 Developed Markets countries* around the world, excluding the US and Canada. The index is comprehensive, covering approximately 85% of the free float-adjusted market capitalization in each country."The MSCI EAFE Index is an equity index which captures large and mid cap representation across 21 Developed Markets countries*around the world, excluding the US and Canada. With 843 constituents, the index covers approximately 85% of the free float adjusted market capitalization in each country." | Vanguard FTSE Developed Markets ETF (VEA) | 12/31/1969 | 12/31/1987 | ||
| Sector - Consumer Discretionary | 0.390% | S&P Global 1200 Consumer Discretionary Sector IdxThe S&P Global 1200 Consumer Discretionary (Sector) Capped Index is designed to measure members of the S&P Global 1200 that are classified within the GICS® consumer discretionary sector, with a cap applied to ensure diversification among companies within the index. | iShares Global Consumer Discr ETF (RXI) | 12/31/1994 | 05/31/2026 |
| S&P 500 IndexThe Standard and Poor's 500, or simply the S&P 500,[5] is a stock market index tracking the stock performance of 500 large companies listed on stock exchanges in the United States. It is one of the most commonly followed equity indices. As of December 31, 2020, more than $5.4 trillion was invested in assets tied to the performance of the index. | State Street SPDR S&P 500 ETF (SPY) | 06/30/1963 | 12/31/1994 | ||
| Sector - Consumer Staples | 0.390% | S&P Global 1200 Consumer Staples Sector IdxThe S&P Global 1200 Consumer Discretionary (Sector) Capped Index is designed to measure members of the S&P Global 1200 that are classified within the GICS® consumer staples sector, with a cap applied to ensure diversification among companies within the index. | iShares Global Consumer Staples ETF (KXI) | 12/31/1994 | 05/31/2026 |
| S&P 500 IndexThe Standard and Poor's 500, or simply the S&P 500,[5] is a stock market index tracking the stock performance of 500 large companies listed on stock exchanges in the United States. It is one of the most commonly followed equity indices. As of December 31, 2020, more than $5.4 trillion was invested in assets tied to the performance of the index. | State Street SPDR S&P 500 ETF (SPY) | 06/30/1963 | 12/31/1994 | ||
| Sector - Energy | 0.400% | S&P Global 1200 Energy Sector IdxThe S&P Global 1200 Energy index consists of all members of the S&P Global 1200 that are classified within the GICS® energy sector. | iShares Global Energy ETF (IXC) | 12/31/1994 | 05/31/2026 |
| S&P 500 IndexThe Standard and Poor's 500, or simply the S&P 500,[5] is a stock market index tracking the stock performance of 500 large companies listed on stock exchanges in the United States. It is one of the most commonly followed equity indices. As of December 31, 2020, more than $5.4 trillion was invested in assets tied to the performance of the index. | State Street SPDR S&P 500 ETF (SPY) | 06/30/1963 | 12/31/1994 | ||
| Sector - Financials | 0.410% | S&P Global 1200 Financials Sector IdxThe S&P Global 1200 Financials index consists of all members of the S&P Global 1200 that are classified within the GICS® financials sector. | iShares Global Financials ETF (IXG) | 12/31/1994 | 05/31/2026 |
| S&P 500 IndexThe Standard and Poor's 500, or simply the S&P 500,[5] is a stock market index tracking the stock performance of 500 large companies listed on stock exchanges in the United States. It is one of the most commonly followed equity indices. As of December 31, 2020, more than $5.4 trillion was invested in assets tied to the performance of the index. | State Street SPDR S&P 500 ETF (SPY) | 06/30/1963 | 12/31/1994 | ||
| Sector - Health Care | 0.400% | S&P Global 1200 Healthcare Sector IdxThe S&P Global 1200 Health Care index consists of all members of the S&P Global 1200 that are classified within the GICS® health care sector. | iShares Global Healthcare ETF (IXJ) | 12/31/1994 | 05/31/2026 |
| S&P 500 IndexThe Standard and Poor's 500, or simply the S&P 500,[5] is a stock market index tracking the stock performance of 500 large companies listed on stock exchanges in the United States. It is one of the most commonly followed equity indices. As of December 31, 2020, more than $5.4 trillion was invested in assets tied to the performance of the index. | State Street SPDR S&P 500 ETF (SPY) | 06/30/1963 | 12/31/1994 | ||
| Sector - Industrials | 0.390% | S&P Global 1200 Industrials Sector IdxThe S&P Global 1200 ADR Ex-Industrials (Sector) Index is designed to measure constituents of the S&P Global 1200 ADR Index, excluding members of the Industrials sector. | iShares Global Industrials ETF (EXI) | 12/31/1994 | 05/31/2026 |
| S&P 500 IndexThe Standard and Poor's 500, or simply the S&P 500,[5] is a stock market index tracking the stock performance of 500 large companies listed on stock exchanges in the United States. It is one of the most commonly followed equity indices. As of December 31, 2020, more than $5.4 trillion was invested in assets tied to the performance of the index. | State Street SPDR S&P 500 ETF (SPY) | 06/30/1963 | 12/31/1994 | ||
| Sector - Information Technology | 0.390% | S&P Global 1200 Information Technology Sector IdxThe S&P Global 1200 Information Technology index consists of all members of the S&P Global 1200 that are classified within the GICS® information technology sector. | iShares Global Tech ETF (IXN) | 12/31/1994 | 05/31/2026 |
| S&P 500 IndexThe Standard and Poor's 500, or simply the S&P 500,[5] is a stock market index tracking the stock performance of 500 large companies listed on stock exchanges in the United States. It is one of the most commonly followed equity indices. As of December 31, 2020, more than $5.4 trillion was invested in assets tied to the performance of the index. | State Street SPDR S&P 500 ETF (SPY) | 06/30/1963 | 12/31/1994 | ||
| Sector - Materials | 0.390% | S&P Global 1200 Materials Sector IdxThe S&P Global 1200 ADR Ex-Materials (Sector) Index is designed to measure constituents of the S&P Global 1200 ADR Index, excluding members of the Materials sector. | iShares Global Materials ETF (MXI) | 12/31/1994 | 05/31/2026 |
| S&P 500 IndexThe Standard and Poor's 500, or simply the S&P 500,[5] is a stock market index tracking the stock performance of 500 large companies listed on stock exchanges in the United States. It is one of the most commonly followed equity indices. As of December 31, 2020, more than $5.4 trillion was invested in assets tied to the performance of the index. | State Street SPDR S&P 500 ETF (SPY) | 06/30/1963 | 12/31/1994 | ||
| Sector - Telecom | 0.400% | S&P Global 1200 Telecommunications Sector IdxThe S&P Global 1200 ADR Ex-Communication Services (Sector) Index is designed to measure constituents of the S&P Global 1200 ADR Index, excluding members of the Communication Services sector. | iShares Global Comm Services ETF (IXP) | 12/31/1994 | 05/31/2026 |
| S&P 500 IndexThe Standard and Poor's 500, or simply the S&P 500,[5] is a stock market index tracking the stock performance of 500 large companies listed on stock exchanges in the United States. It is one of the most commonly followed equity indices. As of December 31, 2020, more than $5.4 trillion was invested in assets tied to the performance of the index. | State Street SPDR S&P 500 ETF (SPY) | 06/30/1963 | 12/31/1994 | ||
| Sector - Utilities | 0.390% | S&P Global 1200 Utiliities Sector IdxThe S&P Global 1200 Utilities (Sector) Capped Index is designed to measure members of the S&P Global 1200 that are classified within the GICS® Utilities sector, with a cap applied to ensure diversification among companies within the index. | iShares Global Utilities ETF (JXI) | 12/31/1994 | 05/31/2026 |
| S&P 500 IndexThe Standard and Poor's 500, or simply the S&P 500,[5] is a stock market index tracking the stock performance of 500 large companies listed on stock exchanges in the United States. It is one of the most commonly followed equity indices. As of December 31, 2020, more than $5.4 trillion was invested in assets tied to the performance of the index. | State Street SPDR S&P 500 ETF (SPY) | 06/30/1963 | 12/31/1994 | ||
| Sector - Natural Resources | 0.400% | SPDR S&P Global Natural Resources ETFThe investment seeks investment results that, before fees and expenses, correspond generally to the total return performance of the S&P Global Natural Resources Index. The fund generally invests substantially all, but at least 80%, of its total assets in the securities comprising the index and in depositary receipts based on securities comprising the index. The index is comprised of 90 of the largest U.S. and foreign publicly-traded companies, based on market capitalization, in natural resources and commodities businesses that meet certain investability requirements. | State Street SPDR S&P Glb Ntrl Rs ETF (GNR) | 09/30/2010 | 05/31/2026 |
| S&P 500 IndexThe Standard and Poor's 500, or simply the S&P 500,[5] is a stock market index tracking the stock performance of 500 large companies listed on stock exchanges in the United States. It is one of the most commonly followed equity indices. As of December 31, 2020, more than $5.4 trillion was invested in assets tied to the performance of the index. | State Street SPDR S&P 500 ETF (SPY) | 06/30/1963 | 09/30/2010 | ||
| Sector - Infrastructure | 0.300% | NYSE FactSet U.S. Infrastructure Index | iShares US Infrastructure ETF (IFRA) | 04/30/2018 | 05/31/2026 |
| S&P 500 IndexThe Standard and Poor's 500, or simply the S&P 500,[5] is a stock market index tracking the stock performance of 500 large companies listed on stock exchanges in the United States. It is one of the most commonly followed equity indices. As of December 31, 2020, more than $5.4 trillion was invested in assets tied to the performance of the index. | State Street SPDR S&P 500 ETF (SPY) | 06/30/1963 | 04/30/2018 | ||
| Commodities | 0.590% | S&P/GSCI Total Return IndexThe S&P GSCI is the first major investable commodity index. It is one of the most widely recognized benchmarks that is broad-based and production weighted to represent the global commodity market beta. The index is designed to be investable by including the most liquid commodity futures, and provides diversification with low correlations to other asset classes. | Invesco Optm Yd Dvrs Cdty Stra No K1 ETF (PDBC) | 12/31/1969 | 05/31/2026 |
| S&P 500 IndexThe Standard and Poor's 500, or simply the S&P 500,[5] is a stock market index tracking the stock performance of 500 large companies listed on stock exchanges in the United States. It is one of the most commonly followed equity indices. As of December 31, 2020, more than $5.4 trillion was invested in assets tied to the performance of the index. | State Street SPDR S&P 500 ETF (SPY) | 06/30/1963 | 12/31/1969 | ||
| Gold | 0.250% | Gold BullionThe price of spot gold. | iShares Gold Trust (IAU) | 01/31/1968 | 05/31/2026 |
| S&P/GSCI Total Return IndexThe S&P GSCI is the first major investable commodity index. It is one of the most widely recognized benchmarks that is broad-based and production weighted to represent the global commodity market beta. The index is designed to be investable by including the most liquid commodity futures, and provides diversification with low correlations to other asset classes. | Invesco Optm Yd Dvrs Cdty Stra No K1 ETF (PDBC) | 12/31/1969 | 01/31/1968 | ||
| S&P 500 IndexThe Standard and Poor's 500, or simply the S&P 500,[5] is a stock market index tracking the stock performance of 500 large companies listed on stock exchanges in the United States. It is one of the most commonly followed equity indices. As of December 31, 2020, more than $5.4 trillion was invested in assets tied to the performance of the index. | State Street SPDR S&P 500 ETF (SPY) | 06/30/1963 | 12/31/1969 | ||
| Silver | 0.500% | Silver BullionThe iShares® Silver Trust (the "Trust") is a grantor trust designed to provide investors with a simple and cost-effective method to gain exposure to the price of silver in an investment portfolio. The Trust holds silver bullion, and is designed to reflect, at any given time, the price of silver owned by the Trust at that time, less the Trust's expenses and liabilities. | iShares Silver Trust (SLV) | 04/30/2006 | 05/31/2026 |
| Gold BullionThe price of spot gold. | iShares Gold Trust (IAU) | 01/31/1968 | 04/30/2006 | ||
| S&P 500 IndexThe Standard and Poor's 500, or simply the S&P 500,[5] is a stock market index tracking the stock performance of 500 large companies listed on stock exchanges in the United States. It is one of the most commonly followed equity indices. As of December 31, 2020, more than $5.4 trillion was invested in assets tied to the performance of the index. | State Street SPDR S&P 500 ETF (SPY) | 06/30/1963 | 01/31/1968 | ||
| U.S. Real Estate | 0.130% | Dow Jones U.S. Select REIT IndexIt tracks the performance of publicly traded REITs and REIT-like securities and is designed to serve as a proxy for direct real estate investment, in part by excluding companies whose performance may be driven by factors other than the value of real estate. The index is a subset of the Dow Jones U.S. Select Real Estate Securities Index (RESI), which represents equity real estate investment trusts (REITs) and real estate operating companies (REOCs) traded in the U.S. | Vanguard Real Estate ETF (VNQ) | 12/31/1971 | 05/31/2026 |
| S&P 500 IndexThe Standard and Poor's 500, or simply the S&P 500,[5] is a stock market index tracking the stock performance of 500 large companies listed on stock exchanges in the United States. It is one of the most commonly followed equity indices. As of December 31, 2020, more than $5.4 trillion was invested in assets tied to the performance of the index. | State Street SPDR S&P 500 ETF (SPY) | 06/30/1963 | 12/31/1971 | ||
| Intl Real Estate | 0.590% | Dow Jones Global ex-U.S. Select Real Estate Sec InThe Dow Jones® Global ex-U.S. Select Real Estate Securities IndexSM is a float-adjusted market capitalization index designed to measure the performance of publicly traded real estate securities in countries excluding the United States. The Index’s composition is reviewed quarterly. The Index is a measure of the types of global real estate securities that represent the ownership and operation of commercial or residential real estate. The Index includes equity Real Estate Investment Trusts (“REITs”) and real estate operating companies that meet a defined criteria, as summarized in the Fund’s prospectus. The Index is rebalanced quarterly effective after the close of trading on the third Friday in March, June, September and December. The reference date is the third Friday of February, May, August, and November.It tracks the performance of equity real estate investment trusts (REITs) and real estate operating companies (REOCs) traded globally, excluding the U.S. The index is designed to serve as a proxy for direct real estate investment, in part by excluding companies whose performance may be driven by factors other than the value of real estate. | State Street SPDR Dow Jones IntlREETF (RWX) | 12/31/2006 | 05/31/2026 |
| Dow Jones U.S. Select REIT IndexIt tracks the performance of publicly traded REITs and REIT-like securities and is designed to serve as a proxy for direct real estate investment, in part by excluding companies whose performance may be driven by factors other than the value of real estate. The index is a subset of the Dow Jones U.S. Select Real Estate Securities Index (RESI), which represents equity real estate investment trusts (REITs) and real estate operating companies (REOCs) traded in the U.S. | Vanguard Real Estate ETF (VNQ) | 12/31/1971 | 12/31/2006 | ||
| S&P 500 IndexThe Standard and Poor's 500, or simply the S&P 500,[5] is a stock market index tracking the stock performance of 500 large companies listed on stock exchanges in the United States. It is one of the most commonly followed equity indices. As of December 31, 2020, more than $5.4 trillion was invested in assets tied to the performance of the index. | State Street SPDR S&P 500 ETF (SPY) | 06/30/1963 | 12/31/1971 | ||
| Berkshire Hathaway | 0.000% | Berkshire Hathaway (Class A common stock)This is the stock of Berkshire Hathaway Class A shares. | Berkshire Hathaway (BRK.B) | 12/31/1979 | 05/31/2026 |
| S&P 500 IndexThe Standard and Poor's 500, or simply the S&P 500,[5] is a stock market index tracking the stock performance of 500 large companies listed on stock exchanges in the United States. It is one of the most commonly followed equity indices. As of December 31, 2020, more than $5.4 trillion was invested in assets tied to the performance of the index. | State Street SPDR S&P 500 ETF (SPY) | 06/30/1963 | 12/31/1979 | ||
| Patton Edge Strategy | 0.000% | Patton Edge StrategyPatton Edge Strategy | n/a | 06/30/1963 | 05/31/2026 |
| S&P 500 IndexThe Standard and Poor's 500, or simply the S&P 500,[5] is a stock market index tracking the stock performance of 500 large companies listed on stock exchanges in the United States. It is one of the most commonly followed equity indices. As of December 31, 2020, more than $5.4 trillion was invested in assets tied to the performance of the index. | State Street SPDR S&P 500 ETF (SPY) | 06/30/1963 | 06/30/1963 | ||
| Patton Flex | 0.000% | Patton Flex Strategy - Perf Fee | n/a | 06/30/1963 | 05/31/2026 |
| S&P 500 IndexThe Standard and Poor's 500, or simply the S&P 500,[5] is a stock market index tracking the stock performance of 500 large companies listed on stock exchanges in the United States. It is one of the most commonly followed equity indices. As of December 31, 2020, more than $5.4 trillion was invested in assets tied to the performance of the index. | State Street SPDR S&P 500 ETF (SPY) | 06/30/1963 | 06/30/1963 | ||
| Patton Flex Strategy - No Enhancement (Gross) | 0.000% | Patton Flex Strategy - No Enhancement - GrossThis represents the GROSS actual performance of the Patton Flex Strategy from its inception in January 2010. All performance prior to this inception date is simulated (see disclosure on simulated performance). No management fees or performance fees have been deducted from this performance. This data is used to show simulated performance of a total portfolio when fees are calculated at the portfolio level. An enhancement to the Strategy was implemented in March 2021. This enhancement is NOT reflected in any of this performance data prior to March 2021. | n/a | 06/30/1963 | 05/31/2026 |
| S&P 500 IndexThe Standard and Poor's 500, or simply the S&P 500,[5] is a stock market index tracking the stock performance of 500 large companies listed on stock exchanges in the United States. It is one of the most commonly followed equity indices. As of December 31, 2020, more than $5.4 trillion was invested in assets tied to the performance of the index. | State Street SPDR S&P 500 ETF (SPY) | 06/30/1963 | 06/30/1963 | ||
| Patton Flex Strategy - No Enhancement (Mgt Fee) | 0.000% | Patton Flex Strategy - No Enhancement - Mgt FeeThis represents the actual performance of the Patton Flex Strategy from its inception in January 2010 less a management fee of 1.50% annually. All performance prior to this inception date is simulated (see disclosure on simulated performance). An enhancement to the Strategy was implemented in March 2021. This enhancement is NOT reflected in any of this performance data prior to March 2021. | n/a | 06/30/1963 | 05/31/2026 |
| S&P 500 IndexThe Standard and Poor's 500, or simply the S&P 500,[5] is a stock market index tracking the stock performance of 500 large companies listed on stock exchanges in the United States. It is one of the most commonly followed equity indices. As of December 31, 2020, more than $5.4 trillion was invested in assets tied to the performance of the index. | State Street SPDR S&P 500 ETF (SPY) | 06/30/1963 | 06/30/1963 | ||
| Patton Flex Strategy - No Enhancement (Perf Fee) | 0.000% | Patton Flex FundThis represents the actual net performance of the Patton Flex Fund, L.P. from February 2010 and later. All performance prior to this date is simulated (see disclosure on simulated performance). There is no management fee, an annual hurdle of 12%, and a 50% incentive fee. See disclosure. An enhancement to the strategy of the Fund was implemented in March 2021 the impact of which is not reflected in any data prior to March 2021. This Fund is only available to investors who meet the Qualified Client requirements as specificied by the Securities and Exchange Commission. | n/a | 06/30/1963 | 05/31/2026 |
| S&P 500 IndexThe Standard and Poor's 500, or simply the S&P 500,[5] is a stock market index tracking the stock performance of 500 large companies listed on stock exchanges in the United States. It is one of the most commonly followed equity indices. As of December 31, 2020, more than $5.4 trillion was invested in assets tied to the performance of the index. | State Street SPDR S&P 500 ETF (SPY) | 06/30/1963 | 06/30/1963 | ||
| Patton Flex Strategy - Gross | 0.000% | Patton Flex Strategy - GrossThis represents the GROSS actual performance of the Patton Flex Strategy from April 2021 and later. All performance prior to this date is simulated (see disclosure on simulated performance). No management fees or performance fees have been deducted from this performance. This data is used to show simulated performance of a total portfolio when fees are calculated at the portfolio level. An enhancement to the Strategy was implemented in March 2021. The impact of this enhancement is reflected in all of this performance data. | n/a | 06/30/1963 | 05/31/2026 |
| S&P 500 IndexThe Standard and Poor's 500, or simply the S&P 500,[5] is a stock market index tracking the stock performance of 500 large companies listed on stock exchanges in the United States. It is one of the most commonly followed equity indices. As of December 31, 2020, more than $5.4 trillion was invested in assets tied to the performance of the index. | State Street SPDR S&P 500 ETF (SPY) | 06/30/1963 | 06/30/1963 | ||
| Patton Flex Strategy | 0.000% | Patton Flex Strategy - NetThis represents the net actual performance of the Patton Flex Strategy from April 2021 and later less a management fee of 1.50% annually. All performance prior to this date is simulated (see disclosure on simulated performance). An enhancement to the Strategy was implemented in March 2021. The impact of this enhancement is reflected in all of this performance data. | n/a | 06/30/1963 | 05/31/2026 |
| S&P 500 IndexThe Standard and Poor's 500, or simply the S&P 500,[5] is a stock market index tracking the stock performance of 500 large companies listed on stock exchanges in the United States. It is one of the most commonly followed equity indices. As of December 31, 2020, more than $5.4 trillion was invested in assets tied to the performance of the index. | State Street SPDR S&P 500 ETF (SPY) | 06/30/1963 | 06/30/1963 | ||
| Audacity Strategy | 0.000% | Audacity Strategy - Performance FeeThis represents the net actual performance of the Audacity Strategy from April 2021 and later less a 2.00% management fee and 20% of the net gains above 0% annually. All performance prior to this date is simulated (see disclosure on simulated performance). An enhancement to the Strategy was implemented in March 2021. The impact of this enhancement is reflected in all of this performance data. | n/a | 06/30/1963 | 05/31/2026 |
| S&P 500 IndexThe Standard and Poor's 500, or simply the S&P 500,[5] is a stock market index tracking the stock performance of 500 large companies listed on stock exchanges in the United States. It is one of the most commonly followed equity indices. As of December 31, 2020, more than $5.4 trillion was invested in assets tied to the performance of the index. | State Street SPDR S&P 500 ETF (SPY) | 06/30/1963 | 06/30/1963 | ||
| Audacity Strategy (Gross) | 0.000% | Audacity Strategy - GrossThis represents the GROSS actual performance of the Audacity Strategy from April 2021 and later. All performance prior to this date is simulated (see disclosure on simulated performance). No management fees or performance fees have been deducted from this performance. This data is used to show simulated performance of a total portfolio when fees are calculated at the portfolio level. An enhancement to the Strategy was implemented in March 2021. The impact of this enhancement is reflected in all of this performance data. | n/a | 06/30/1963 | 05/31/2026 |
| S&P 500 IndexThe Standard and Poor's 500, or simply the S&P 500,[5] is a stock market index tracking the stock performance of 500 large companies listed on stock exchanges in the United States. It is one of the most commonly followed equity indices. As of December 31, 2020, more than $5.4 trillion was invested in assets tied to the performance of the index. | State Street SPDR S&P 500 ETF (SPY) | 06/30/1963 | 06/30/1963 | ||
| Audacity Strategy (Mgt Fee) | 0.000% | Audacity Strategy - Management FeeThis represents the net actual performance of the Audacity Strategy from April 2021 and later less a management fee of 4.00% annually. All performance prior to this date is simulated (see disclosure on simulated performance). An enhancement to the Strategy was implemented in March 2021. The impact of this enhancement is reflected in all of this performance data. | n/a | 06/30/1963 | 05/31/2026 |
| S&P 500 IndexThe Standard and Poor's 500, or simply the S&P 500,[5] is a stock market index tracking the stock performance of 500 large companies listed on stock exchanges in the United States. It is one of the most commonly followed equity indices. As of December 31, 2020, more than $5.4 trillion was invested in assets tied to the performance of the index. | State Street SPDR S&P 500 ETF (SPY) | 06/30/1963 | 06/30/1963 | ||
| Audacity Strategy - No Enhancement (Gross) | 0.000% | Audacity Strategy - No Enhancement - GrossThis represents the GROSS actual performance of the Audacity Strategy from its inception in April 2020. All performance prior to this inception date is simulated (see disclosure on simulated performance). No management fees or performance fees have been deducted from this performance. This data is used to show simulated performance of a total portfolio when fees are calculated at the portfolio level. An enhancement to the Strategy was implemented in March 2021. This enhancement is NOT reflected in any of this performance data prior to March 2021. | n/a | 06/30/1963 | 05/31/2026 |
| S&P 500 IndexThe Standard and Poor's 500, or simply the S&P 500,[5] is a stock market index tracking the stock performance of 500 large companies listed on stock exchanges in the United States. It is one of the most commonly followed equity indices. As of December 31, 2020, more than $5.4 trillion was invested in assets tied to the performance of the index. | State Street SPDR S&P 500 ETF (SPY) | 06/30/1963 | 06/30/1963 | ||
| Audacity Strategy - No Enhancement (Mgt Fee) | 0.000% | Audacity Strategy - No Enhancement - Mgt FeeThis represents the actual performance of the Audacity Strategy from its inception in April 2020 less a management fee of 4.00% annually. All performance prior to this inception date is simulated (see disclosure on simulated performance). An enhancement to the Strategy was implemented in March 2021. This enhancement is NOT reflected in any of this performance data prior to March 2021. | n/a | 06/30/1963 | 05/31/2026 |
| S&P 500 IndexThe Standard and Poor's 500, or simply the S&P 500,[5] is a stock market index tracking the stock performance of 500 large companies listed on stock exchanges in the United States. It is one of the most commonly followed equity indices. As of December 31, 2020, more than $5.4 trillion was invested in assets tied to the performance of the index. | State Street SPDR S&P 500 ETF (SPY) | 06/30/1963 | 06/30/1963 | ||
| Audacity Strategy - No Enhancement (Perf Fee) | 0.000% | Audacity Strategy - No Enhancement - Perf FeeThis represents the actual performance of the Audacity Strategy from its inception in April 2020 less a 2.00% management fee and 20% of the net gains above 0% annually. All performance prior to this inception date is simulated (see disclosure on simulated performance). An enhancement to the Strategy was implemented in March 2021. This enhancement is NOT reflected in any of this performance data prior to March 2021. | n/a | 06/30/1963 | 05/31/2026 |
| S&P 500 IndexThe Standard and Poor's 500, or simply the S&P 500,[5] is a stock market index tracking the stock performance of 500 large companies listed on stock exchanges in the United States. It is one of the most commonly followed equity indices. As of December 31, 2020, more than $5.4 trillion was invested in assets tied to the performance of the index. | State Street SPDR S&P 500 ETF (SPY) | 06/30/1963 | 06/30/1963 | ||
| Agriculture | 0.850% | DB AgricultureIt seeks to track changes, whether positive or negative, in the level of the DBIQ Diversified Agriculture Index Excess Return™ (DBIQ Diversified Agriculture Index ER or Index) plus the interest income from the Fund's holdings of primarily US Treasury securities and money market income less the Fund's expenses. The Fund is designed for investors who want a cost-effective and convenient way to invest in commodity futures. The Index is a rules-based index composed of futures contracts on some of the most liquid and widely traded agricultural commodities. You cannot invest directly in the Index. The Fund and the Index are rebalanced and reconstituted annually in November. | Invesco DB Agriculture (DBA) | 01/31/2007 | 05/31/2026 |
| S&P/GSCI Total Return IndexThe S&P GSCI is the first major investable commodity index. It is one of the most widely recognized benchmarks that is broad-based and production weighted to represent the global commodity market beta. The index is designed to be investable by including the most liquid commodity futures, and provides diversification with low correlations to other asset classes. | Invesco Optm Yd Dvrs Cdty Stra No K1 ETF (PDBC) | 12/31/1969 | 01/31/2007 | ||
| S&P 500 IndexThe Standard and Poor's 500, or simply the S&P 500,[5] is a stock market index tracking the stock performance of 500 large companies listed on stock exchanges in the United States. It is one of the most commonly followed equity indices. As of December 31, 2020, more than $5.4 trillion was invested in assets tied to the performance of the index. | State Street SPDR S&P 500 ETF (SPY) | 06/30/1963 | 12/31/1969 | ||
| Barclays Long/Short Equity | 0.000% | BarclaysHedge Equity Long/ShortThis directional strategy involves equity-oriented investing on both the long and short sides of the market. The objective is not to be market neutral. Managers have the ability to shift from value to growth, from small to medium to large capitalization stocks, and from a net long position to a net short position. Managers may use futures and options to hedge. The focus may be regional or sector specific. | n/a | 09/30/2022 | 04/30/2026 |
| Credit Suisse Long/Short EquityThis directional strategy involves equity-oriented investing on both the long and short sides of the market. The objective is not to be market neutral. Managers have the ability to shift from value to growth, from small to medium to large capitalization stocks, and from a net long position to a net short position.This is a subset of the Credit Suisse Hedge Fund Index that measures the aggregate performance of dedicated short bias funds. | n/a | 12/31/1993 | 09/30/2022 | ||
| S&P 500 IndexThe Standard and Poor's 500, or simply the S&P 500,[5] is a stock market index tracking the stock performance of 500 large companies listed on stock exchanges in the United States. It is one of the most commonly followed equity indices. As of December 31, 2020, more than $5.4 trillion was invested in assets tied to the performance of the index. | State Street SPDR S&P 500 ETF (SPY) | 06/30/1963 | 12/31/1993 | ||
| Barclays Equity Market Neutral | 0.000% | BarclaysHedge Equity Market NeutralThis investment strategy is designed to exploit equity market inefficiencies and usually involves being simultaneously long and short matched equity portfolios of the same size within a country. Market neutral portfolios are designed to be either beta or currency neutral, or both. Well-designed portfolios typically control for industry, sector, market capitalization, and other exposures. Leverage is often applied to enhance returns. | n/a | 09/30/2022 | 04/30/2026 |
| Credit Suisse Equity Market NeutralThe Credit Suisse Market Neutral Equity ETNs are designed for investors who seek exposure to the performance of the HS Market Neutral Index Powered by HOLT (the Index). The ETNs should be purchased only by knowledgeable investors who understand the potential consequences of investing in this ETN.It is a subset of the Credit Suisse AllHedge Index that measures the aggregate performance of equity market neutral funds. | n/a | 12/31/1993 | 09/30/2022 | ||
| S&P 500 IndexThe Standard and Poor's 500, or simply the S&P 500,[5] is a stock market index tracking the stock performance of 500 large companies listed on stock exchanges in the United States. It is one of the most commonly followed equity indices. As of December 31, 2020, more than $5.4 trillion was invested in assets tied to the performance of the index. | State Street SPDR S&P 500 ETF (SPY) | 06/30/1963 | 12/31/1993 | ||
| HFRX Equity Hedge | 0.000% | HFRX Equity HedgeEquity Hedge strategies maintain positions both long and short in primarily equity and equity derivative securities. A wide variety of investment processes can be employed to arrive at an investment decision, including both quantitative and fundamental techniques; strategies can be broadly diversified or narrowly focused on specific sectors and can range broadly in terms of levels of net exposure, leverage employed, holding period, concentrations of market capitalizations and valuation ranges of typical portfolios. Equity Hedge managers would typically maintain at least 50%, and may in some cases be substantially entirely invested in equities, both long and short. Hedge Fund Research, Inc. (HFR) utilizes a UCITSIII compliant methodology to construct the HFRX Hedge Fund Indices. The methodology is based on defined and predetermined rules and objective criteria to select and rebalance components to maximize representation of the Hedge Fund Universe. HFRX Indices utilize state-of-the-art quantitative techniques and analysis; multi-level screening, cluster analysis, Monte-Carlo simulations and optimization techniques ensure that each Index is a pure representation of its corresponding investment focus. | n/a | 12/31/1997 | 05/31/2026 |
| eVestment Fund of FundseVestment, a part of Nasdaq, provides institutional investment data, analytics and market intelligence covering public and private markets. Asset managers and general partners reach the institutional marketplace through our platform, while institutional investors and consultants rely on eVestment for manager due diligence, selection and monitoring. eVestment brings transparency and efficiency to the global institutional market, equipping managers, investors and consultants to make data-driven decisions, deploy their resources more productively and ultimately realize better outcomes. | n/a | 12/31/1979 | 12/31/1997 | ||
| S&P 500 IndexThe Standard and Poor's 500, or simply the S&P 500,[5] is a stock market index tracking the stock performance of 500 large companies listed on stock exchanges in the United States. It is one of the most commonly followed equity indices. As of December 31, 2020, more than $5.4 trillion was invested in assets tied to the performance of the index. | State Street SPDR S&P 500 ETF (SPY) | 06/30/1963 | 12/31/1979 | ||
| HFRX Global Hedge Funds | 0.000% | HFRX Global HedgeThe HFRX Global Hedge Fund Index is designed to be representative of the overall composition of the hedge fund universe. It is comprised of all eligible hedge fund strategies; including but not limited to convertible arbitrage, distressed securities, equity hedge, equity market neutral, event driven, macro, merger arbitrage, and relative value arbitrage. The strategies are asset weighted based on the distribution of assets in the hedge fund industry. Hedge Fund Research, Inc. (HFR) utilizes a UCITSIII compliant methodology to construct the HFRX Hedge Fund Indices. The methodology is based on defined and predetermined rules and objective criteria to select and rebalance components to maximize representation of the Hedge Fund Universe. HFRX Indices utilize state-of-the-art quantitative techniques and analysis; multi-level screening, cluster analysis, Monte-Carlo simulations and optimization techniques ensure that each Index is a pure representation of its corresponding investment focus. | n/a | 12/31/1997 | 05/31/2026 |
| S&P 500 IndexThe Standard and Poor's 500, or simply the S&P 500,[5] is a stock market index tracking the stock performance of 500 large companies listed on stock exchanges in the United States. It is one of the most commonly followed equity indices. As of December 31, 2020, more than $5.4 trillion was invested in assets tied to the performance of the index. | State Street SPDR S&P 500 ETF (SPY) | 06/30/1963 | 12/31/1997 | ||
| HFRX Eq Mkt Neutral | 0.000% | HFRX Equity Market NeutralMonthly-reporting HFRX Index constituents are comprised of private hedge funds. Equity Market Neutral strategies employ sophisticated quantitative techniques of analyzing price data to ascertain information about future price movement and relationships between securities, select securities for purchase and sale.Equity Market Neutral strategies employ sophisticated quantitative techniques of analyzing price data to ascertain information about future price movement and relationships between securities, select securities for purchase and sale. These can include both Factor-based and Statistical Arbitrage/Trading strategies. Factor-based investment strategies include strategies in which the investment thesis is predicated on the systematic analysis of common relationships between securities. In many but not all cases, portfolios are constructed to be neutral to one or multiple variables, such as broader equity markets in dollar or beta terms, and leverage is frequently employed to enhance the return profile of the positions identified. Statistical Arbitrage/Trading strategies consist of strategies in which the investment thesis is predicated on exploiting pricing anomalies which may occur as a function of expected mean reversion inherent in security prices; high frequency techniques may be employed and trading strategies may also be employed on the basis on technical analysis or opportunistically to exploit new information the investment manager believes has not been fully, completely or accurately discounted into current security prices. Equity Market Neutral Strategies typically maintain characteristic net equity market exposure no greater than 10% long or short. Hedge Fund Research, Inc. (HFR) utilizes a UCITSIII compliant methodology to construct the HFRX Hedge Fund Indices. The methodology is based on defined and predetermined rules and objective criteria to select and rebalance components to maximize representation of the Hedge Fund Universe. HFRX Indices utilize state-of-the-art quantitative techniques and analysis; multi-level screening, cluster analysis, Monte-Carlo simulations and optimization techniques ensure that each Index is a pure representation of its corresponding investment focus. | n/a | 12/31/1997 | 05/31/2026 |
| eVestment Fund of FundseVestment, a part of Nasdaq, provides institutional investment data, analytics and market intelligence covering public and private markets. Asset managers and general partners reach the institutional marketplace through our platform, while institutional investors and consultants rely on eVestment for manager due diligence, selection and monitoring. eVestment brings transparency and efficiency to the global institutional market, equipping managers, investors and consultants to make data-driven decisions, deploy their resources more productively and ultimately realize better outcomes. | n/a | 12/31/1979 | 12/31/1997 | ||
| S&P 500 IndexThe Standard and Poor's 500, or simply the S&P 500,[5] is a stock market index tracking the stock performance of 500 large companies listed on stock exchanges in the United States. It is one of the most commonly followed equity indices. As of December 31, 2020, more than $5.4 trillion was invested in assets tied to the performance of the index. | State Street SPDR S&P 500 ETF (SPY) | 06/30/1963 | 12/31/1979 | ||
| HFR Hedge Equity | 0.000% | HFR Equity HedgeEquity Hedge: Investment Managers who maintain positions both long and short in primarily equity and equity derivative securities. A wide variety of investment processes can be employed to arrive at an investment decision, including both quantitative and fundamental techniques; strategies can be broadly diversified or narrowly focused on specific sectors and can range broadly in terms of levels of net exposure, leverage employed, holding period, concentrations of market capitalizations and valuation ranges of typical portfolios. EH managers would typically maintain at least 50% exposure to, and may in some cases be entirely invested in, equities, both long and short. | n/a | 12/31/1989 | 04/30/2026 |
| eVestment Fund of FundseVestment, a part of Nasdaq, provides institutional investment data, analytics and market intelligence covering public and private markets. Asset managers and general partners reach the institutional marketplace through our platform, while institutional investors and consultants rely on eVestment for manager due diligence, selection and monitoring. eVestment brings transparency and efficiency to the global institutional market, equipping managers, investors and consultants to make data-driven decisions, deploy their resources more productively and ultimately realize better outcomes. | n/a | 12/31/1979 | 12/31/1989 | ||
| S&P 500 IndexThe Standard and Poor's 500, or simply the S&P 500,[5] is a stock market index tracking the stock performance of 500 large companies listed on stock exchanges in the United States. It is one of the most commonly followed equity indices. As of December 31, 2020, more than $5.4 trillion was invested in assets tied to the performance of the index. | State Street SPDR S&P 500 ETF (SPY) | 06/30/1963 | 12/31/1979 | ||
| HFR Composite | 0.000% | HFR CompositeThe HFRI Asset Weighted Composite Index is a global, asset-weighted index comprised of single-manager funds that report to HFR Database. Constituent funds report monthly net of all fees performance in US Dollar and have a minimum of $50 Million under management or $10 Million under management and a twelve (12) month track record of active performance. The HFRI Asset Weighted Composite Index does not include Funds of Hedge Funds. The constituent funds of the HFRI Asset Weighted Composite Index are weighted according to the AUM reported by each fund for the prior month. | n/a | 12/31/1989 | 04/30/2026 |
| eVestment Fund of FundseVestment, a part of Nasdaq, provides institutional investment data, analytics and market intelligence covering public and private markets. Asset managers and general partners reach the institutional marketplace through our platform, while institutional investors and consultants rely on eVestment for manager due diligence, selection and monitoring. eVestment brings transparency and efficiency to the global institutional market, equipping managers, investors and consultants to make data-driven decisions, deploy their resources more productively and ultimately realize better outcomes. | n/a | 12/31/1979 | 12/31/1989 | ||
| S&P 500 IndexThe Standard and Poor's 500, or simply the S&P 500,[5] is a stock market index tracking the stock performance of 500 large companies listed on stock exchanges in the United States. It is one of the most commonly followed equity indices. As of December 31, 2020, more than $5.4 trillion was invested in assets tied to the performance of the index. | State Street SPDR S&P 500 ETF (SPY) | 06/30/1963 | 12/31/1979 | ||
| HFR Fund of Funds | 0.000% | HFR Fund of FundsFOFs classified as 'Conservative' exhibit one or more of the following characteristics: seeks consistent returns by primarily investing in funds that generally engage in more 'conservative' strategies such as Equity Market Neutral, Fixed Income Arbitrage, and Convertible Arbitrage; exhibits a lower historical annual standard deviation than the HFRI Fund of Funds Composite Index. A fund in the HFRI FOF Conservative Index shows generally consistent performance regardless of market conditions. | n/a | 12/31/1989 | 04/30/2026 |
| eVestment Fund of FundseVestment, a part of Nasdaq, provides institutional investment data, analytics and market intelligence covering public and private markets. Asset managers and general partners reach the institutional marketplace through our platform, while institutional investors and consultants rely on eVestment for manager due diligence, selection and monitoring. eVestment brings transparency and efficiency to the global institutional market, equipping managers, investors and consultants to make data-driven decisions, deploy their resources more productively and ultimately realize better outcomes. | n/a | 12/31/1979 | 12/31/1989 | ||
| S&P 500 IndexThe Standard and Poor's 500, or simply the S&P 500,[5] is a stock market index tracking the stock performance of 500 large companies listed on stock exchanges in the United States. It is one of the most commonly followed equity indices. As of December 31, 2020, more than $5.4 trillion was invested in assets tied to the performance of the index. | State Street SPDR S&P 500 ETF (SPY) | 06/30/1963 | 12/31/1979 | ||
| Bitcoin ETF | 0.760% | ARK Next Generation Internet ETFETF that seeks long-term growth of capital by investing under normal circumstances primarily (at least 80% of its assets) in domestic and U.S. exchange traded foreign equity securities of companies that are relevant to the Fund’s investment theme of next generation internet. Exposure to the “Next Generation Internet” including artificial intelligence, big data, cloud computing, cybersecurity, and blockchain technology. | ARK Next Generation Internet ETF (ARKW) | 09/30/2014 | 05/31/2026 |
| S&P 500 IndexThe Standard and Poor's 500, or simply the S&P 500,[5] is a stock market index tracking the stock performance of 500 large companies listed on stock exchanges in the United States. It is one of the most commonly followed equity indices. As of December 31, 2020, more than $5.4 trillion was invested in assets tied to the performance of the index. | State Street SPDR S&P 500 ETF (SPY) | 06/30/1963 | 09/30/2014 | ||
| HFN Hedge Fund of Funds | 0.000% | eVestment Fund of FundseVestment, a part of Nasdaq, provides institutional investment data, analytics and market intelligence covering public and private markets. Asset managers and general partners reach the institutional marketplace through our platform, while institutional investors and consultants rely on eVestment for manager due diligence, selection and monitoring. eVestment brings transparency and efficiency to the global institutional market, equipping managers, investors and consultants to make data-driven decisions, deploy their resources more productively and ultimately realize better outcomes. | n/a | 12/31/1979 | 04/30/2026 |
| S&P 500 IndexThe Standard and Poor's 500, or simply the S&P 500,[5] is a stock market index tracking the stock performance of 500 large companies listed on stock exchanges in the United States. It is one of the most commonly followed equity indices. As of December 31, 2020, more than $5.4 trillion was invested in assets tied to the performance of the index. | State Street SPDR S&P 500 ETF (SPY) | 06/30/1963 | 12/31/1979 | ||
| VIX Volatility Index | 0.000% | CBOE VIX IndexThe VIX Index is a financial benchmark designed to be an up-to-the-minute market estimate of expected volatility of the S&P 500 Index, and is calculated by using the midpoint of real-time S&P 500® Index (SPX) option bid/ask quotes. More specifically, the VIX Index is intended to provide an instantaneous measure of how much the market thinks the S&P 500 Index will fluctuate in the 30 days from the time of each tick of the VIX Index. | n/a | 01/31/1990 | 05/31/2026 |
| S&P 500 IndexThe Standard and Poor's 500, or simply the S&P 500,[5] is a stock market index tracking the stock performance of 500 large companies listed on stock exchanges in the United States. It is one of the most commonly followed equity indices. As of December 31, 2020, more than $5.4 trillion was invested in assets tied to the performance of the index. | State Street SPDR S&P 500 ETF (SPY) | 06/30/1963 | 01/31/1990 | ||
| Preferred Stock | 0.450% | U.S. dollar-denominated preferred and hybrid sec | iShares Preferred&Income Securities ETF (PFF) | 03/31/2007 | 05/31/2026 |
| S&P 500 IndexThe Standard and Poor's 500, or simply the S&P 500,[5] is a stock market index tracking the stock performance of 500 large companies listed on stock exchanges in the United States. It is one of the most commonly followed equity indices. As of December 31, 2020, more than $5.4 trillion was invested in assets tied to the performance of the index. | State Street SPDR S&P 500 ETF (SPY) | 06/30/1963 | 03/31/2007 | ||
| Bitcoin (USD) | 0.150% | Bitcoin USD | Grayscale Bitcoin Mini Trust ETF (BTC) | 06/30/2014 | 05/31/2026 |
| S&P 500 IndexThe Standard and Poor's 500, or simply the S&P 500,[5] is a stock market index tracking the stock performance of 500 large companies listed on stock exchanges in the United States. It is one of the most commonly followed equity indices. As of December 31, 2020, more than $5.4 trillion was invested in assets tied to the performance of the index. | State Street SPDR S&P 500 ETF (SPY) | 06/30/1963 | 06/30/2014 | ||
| Managed Futures | 0.750% | Simplify Managed Futures Strategy ETF (CTA)The investment seeks long term capital appreciation. Under normal market conditions, the fund invests in a portfolio of equity, U.S. Treasury, commodity, and foreign exchange futures contracts (collectively, “Futures Contracts”). Typically, it will not invest directly in commodity futures contracts. The Advisor expects to gain exposure to these investments by investing up to 25% of its assets in a wholly-owned subsidiary of the fund organized under the laws of the Cayman Islands (the “Subsidiary”). | Simplify Managed Futures Strategy ETF (CTA) | 03/31/2022 | 05/31/2026 |
| S&P Strategic Futures IndexThe S&P Strategic Futures Index (S&P SFI) reflects the long term price trend of futures on physical commodities, interest rates, and currencies while limiting volatility and offering transparent, rules-based exposure to momentum, both long and short. | ProShares Managed Futures Strategy (FUTS) | 12/31/1993 | 03/31/2022 | ||
| S&P 500 IndexThe Standard and Poor's 500, or simply the S&P 500,[5] is a stock market index tracking the stock performance of 500 large companies listed on stock exchanges in the United States. It is one of the most commonly followed equity indices. As of December 31, 2020, more than $5.4 trillion was invested in assets tied to the performance of the index. | State Street SPDR S&P 500 ETF (SPY) | 06/30/1963 | 12/31/1993 | ||
| Long-term U.S. Corporate Bonds | 0.140% | Marrkit iBoxx USD Liquid Investment Grade Index | iShares iBoxx $ Invmt Grade Corp Bd ETF (LQD) | 06/30/1963 | 05/31/2026 |
| Long-term U.S. Government Bonds | 0.150% | ICE U.S. Treasury 20+ Year Bond IndexThe ICE U.S. Treasury 20+ Year Bond Index is part of a series of indices intended to the assess U.S. Treasury market. The Index is market value weighted and is designed to measure the performance of U.S. dollar-denominated, fixed rate securities with minimum term to maturity greater than twenty years. The ICE U.S. Treasury Bond Index SeriesTM has an inception date of December 31, 2015. Index history is available back to December 31, 2004. | iShares 20+ Year Treasury Bond ETF (TLT) | 06/30/1963 | 05/31/2026 |
| Mid-term U.S. Government Bonds | 0.150% | ICE U.S. Treasury 7-10 Year Bond IndexThe ICE U.S. Treasury 7-10 Year Bond Index is part of a series of indices intended to assess the U.S. Treasury market. The Index is market value weighted and is designed to measure the performance of U.S. dollar-denominated, fixed rate securities with minimum term to maturity greater than seven years and less than or equal to ten years. The ICE U.S. Treasury Bond Index SeriesTM has an inception date of December 31, 2015. Index history is available back to December 31, 2004. | iShares 7-10 Year Treasury Bond ETF (IEF) | 06/30/1963 | 05/31/2026 |
| Mid-term U.S. Municipal Bonds | 0.050% | S&P National AMT-Free Municipal Bond IndexThe S&P National AMT-Free Municipal Bond Index is a broad, comprehensive, market value-weighted index designed to measure the performance of the investment-grade tax-exempt U.S. municipal bond market.Bonds issued by U.S. territories, including Puerto Rico, are excluded from this index. | iShares National Muni Bond ETF (MUB) | 08/31/2007 | 05/31/2026 |
| ICE U.S. Treasurey Short Bond IndexThe ICE U.S. Treasury Short Bond Index is part of a series of indices intended to assess U.S. Treasury market. The Index is market value weighted, and is designed to include U.S. dollar denominated, fixed rate securities with minimum term to maturity greater than one month and less than or equal to one year. The ICE U.S. Treasury Bond Index SeriesTM has an inception date of December 31, 2015. Index history is available back to December 31, 2005. | iShares 01 Year Treasury Bond ETF (SHV) | 06/30/1963 | 08/31/2007 | ||
| ICE U.S. Treasury 7-10 Year Bond IndexThe ICE U.S. Treasury 7-10 Year Bond Index is part of a series of indices intended to assess the U.S. Treasury market. The Index is market value weighted and is designed to measure the performance of U.S. dollar-denominated, fixed rate securities with minimum term to maturity greater than seven years and less than or equal to ten years. The ICE U.S. Treasury Bond Index SeriesTM has an inception date of December 31, 2015. Index history is available back to December 31, 2004. | iShares 7-10 Year Treasury Bond ETF (IEF) | 06/30/1963 | 06/30/1963 | ||
| U.S. Government TIPS (Bonds) | 0.180% | Bloomberg Barclays U.S. Inflation Protected InxThe Bloomberg Barclays US Treasury Inflation-Linked Bond Index (Series-L) measures the performance of the US Treasury Inflation Protected Securities (TIPS) market. Federal Reserve holdings of US TIPS are not index eligible and are excluded from the face amount outstanding of each bond in the index. The US TIPS Index is a subset and the largest component of the Global Inflation-Linked Bond Index (Series-L). US TIPS are not eligible for other Bloomberg Barclays nominal Treasury or broad-based aggregate bond indices. The US TIPS (Series-L) was launched in March 1997.An index of funds that invest primarily in inflation-indexed fixed income securities issued in the United States. Inflation-indexed bonds are fixed income securities that are structured to provide protection against inflation. | iShares TIPS Bond ETF (TIP) | 12/31/2003 | 05/31/2026 |
| ICE U.S. Treasury 20+ Year Bond IndexThe ICE U.S. Treasury 20+ Year Bond Index is part of a series of indices intended to the assess U.S. Treasury market. The Index is market value weighted and is designed to measure the performance of U.S. dollar-denominated, fixed rate securities with minimum term to maturity greater than twenty years. The ICE U.S. Treasury Bond Index SeriesTM has an inception date of December 31, 2015. Index history is available back to December 31, 2004. | iShares 20+ Year Treasury Bond ETF (TLT) | 06/30/1963 | 12/31/2003 | ||
| High-Yield Corporate Bonds | 0.490% | Marrkit iBoxx USD Liquid High Yield IndexThe Markit iBoxx USD Liquid High Yield Capped Index consists of liquid USD high yield bonds, selected to provide a balanced representation of the broad USD high yield corporate bond universe. The index is used as a basis for tradable products, including ETFs. Multi-contributor pricing and support for the index from leading financial institutions ensure that the index is a tradable reflection of the corporate high yield bond market. | iShares iBoxx $ High Yield Corp Bd ETF (HYG) | 06/30/1983 | 05/31/2026 |
| Marrkit iBoxx USD Liquid Investment Grade Index | iShares iBoxx $ Invmt Grade Corp Bd ETF (LQD) | 06/30/1963 | 06/30/1983 | ||
| ICE U.S. Treasury 20+ Year Bond IndexThe ICE U.S. Treasury 20+ Year Bond Index is part of a series of indices intended to the assess U.S. Treasury market. The Index is market value weighted and is designed to measure the performance of U.S. dollar-denominated, fixed rate securities with minimum term to maturity greater than twenty years. The ICE U.S. Treasury Bond Index SeriesTM has an inception date of December 31, 2015. Index history is available back to December 31, 2004. | iShares 20+ Year Treasury Bond ETF (TLT) | 06/30/1963 | 06/30/1963 | ||
| U.S. Aggregate Bonds | 0.030% | Bloomberg Barclays U.S. Aggregate Float Ad IndexThe Bloomberg Barclays US Aggregate Bond Float Adjusted Index is a broad-based benchmark that measures the investment grade, US dollar-denominated, fixed-rate taxable bond market. The Float-Adjusted version excludes US agency debentures held in the Federal Reserve SOMA account.The Bloomberg Barclays U.S. Aggregate Float Adjusted Index is a rules-based index that measures the investment return of investment-grade, taxable, fixed income securities in the United States—including government, corporate, and international dollar-denominated bonds, as well as mortgage-backed and asset-backed securities—all with maturities longer than1 year. The average maturity is between 5 and 10 years. | Vanguard Total Bond Market ETF (BND) | 12/31/1975 | 05/31/2026 |
| ICE U.S. Treasury 7-10 Year Bond IndexThe ICE U.S. Treasury 7-10 Year Bond Index is part of a series of indices intended to assess the U.S. Treasury market. The Index is market value weighted and is designed to measure the performance of U.S. dollar-denominated, fixed rate securities with minimum term to maturity greater than seven years and less than or equal to ten years. The ICE U.S. Treasury Bond Index SeriesTM has an inception date of December 31, 2015. Index history is available back to December 31, 2004. | iShares 7-10 Year Treasury Bond ETF (IEF) | 06/30/1963 | 12/31/1975 | ||
| Long-term International Bonds | 0.350% | Bloomberg Barclays Global Treasury ex-US Capped InThe investment seeks to provide investment results that correspond generally to the price and yield performance of the Bloomberg Global Aggregate ex-USD >$1B: Corporate Bond Index. The fund invests substantially all, but at least 80%, of its total assets in the securities comprising the index and in securities that the Adviser determines have economic characteristics that are substantially identical to the economic characteristics of the securities that comprise the index. The index is designed to be a broad based measure of the global investment grade, fixed rate, fixed income corporate markets outside the United States.The Bloomberg Barclays Global Treasury ex-US Capped Indexis designed to track the fixed-rate local currency sovereign debtof investment grade countries outside the United States. TheIndex includes government bonds issued by investment gradecountries outside the United States, in local currencies, thathave a remaining maturity of one year or more and are ratedinvestment grade (Baa3/BBB-/BBB-or higher using the middlerating of Moody’s Investors Service, Inc., Standard & Poor’s, Inc.and Fitch Inc., respectively). The Index is calculated by BloombergIndex Services Limited using a modified “market capitalization”methodology. This design ensures that each constituent countrywithin the Index is represented in a proportion consistent with itspercentage with respect to the total market capitalization of theIndex. The index is rebalanced on a monthly basis. | State Street SPDR Blmbg Intl Trs BdETF (BWX) | 12/31/1986 | 05/31/2026 |
| Marrkit iBoxx USD Liquid Investment Grade Index | iShares iBoxx $ Invmt Grade Corp Bd ETF (LQD) | 06/30/1963 | 12/31/1986 | ||
| ICE U.S. Treasury 20+ Year Bond IndexThe ICE U.S. Treasury 20+ Year Bond Index is part of a series of indices intended to the assess U.S. Treasury market. The Index is market value weighted and is designed to measure the performance of U.S. dollar-denominated, fixed rate securities with minimum term to maturity greater than twenty years. The ICE U.S. Treasury Bond Index SeriesTM has an inception date of December 31, 2015. Index history is available back to December 31, 2004. | iShares 20+ Year Treasury Bond ETF (TLT) | 06/30/1963 | 06/30/1963 | ||
| 1-3 Year U.S. Government Bonds | 0.150% | 1-3 Year U.S. Treasury BondsTreasury bonds (T-bonds) are one of four types of debt issued by the U.S. Department of the Treasury to finance the U.S. government’s spending activities. The four types of debt are Treasury bills, Treasury notes, Treasury bonds, and Treasury Inflation-Protected Securities (TIPS). These securities vary by maturity and coupon payments. Maturity time is between 1 to 3 years. | iShares 1-3 Year Treasury Bond ETF (SHY) | 07/31/2002 | 05/31/2026 |
| ICE U.S. Treasury 7-10 Year Bond IndexThe ICE U.S. Treasury 7-10 Year Bond Index is part of a series of indices intended to assess the U.S. Treasury market. The Index is market value weighted and is designed to measure the performance of U.S. dollar-denominated, fixed rate securities with minimum term to maturity greater than seven years and less than or equal to ten years. The ICE U.S. Treasury Bond Index SeriesTM has an inception date of December 31, 2015. Index history is available back to December 31, 2004. | iShares 7-10 Year Treasury Bond ETF (IEF) | 06/30/1963 | 07/31/2002 | ||
| 3-7 Year U.S. Government Bonds | 0.150% | 3-7 Year U.S. Treasury BondsTreasury bonds (T-bonds) are one of four types of debt issued by the U.S. Department of the Treasury to finance the U.S. government’s spending activities. The four types of debt are Treasury bills, Treasury notes, Treasury bonds, and Treasury Inflation-Protected Securities (TIPS). These securities vary by maturity and coupon payments. Maturity time is between 3 to 7 years. | iShares 3-7 Year Treasury Bond ETF (IEI) | 01/31/2007 | 05/31/2026 |
| ICE U.S. Treasury 7-10 Year Bond IndexThe ICE U.S. Treasury 7-10 Year Bond Index is part of a series of indices intended to assess the U.S. Treasury market. The Index is market value weighted and is designed to measure the performance of U.S. dollar-denominated, fixed rate securities with minimum term to maturity greater than seven years and less than or equal to ten years. The ICE U.S. Treasury Bond Index SeriesTM has an inception date of December 31, 2015. Index history is available back to December 31, 2004. | iShares 7-10 Year Treasury Bond ETF (IEF) | 06/30/1963 | 01/31/2007 | ||
| Emerging Markets Bonds | 0.390% | J.P. Morgan EMBI Global Core IndexThe index is a broad, diverse U.S. dollar denominated emerging markets debt benchmark that tracks the total return of actively traded debt instruments in emerging market countries. | iShares JP Morgan USD Em Mkts Bd ETF (EMB) | 11/30/2007 | 05/31/2026 |
| Marrkit iBoxx USD Liquid Investment Grade Index | iShares iBoxx $ Invmt Grade Corp Bd ETF (LQD) | 06/30/1963 | 11/30/2007 | ||
| Intl Short Term Treasury Bonds | 0.350% | S&P/Citigroup Intl Treasury Bond ex-US 1-3 YearThe S&P International Sovereign Ex-U.S. Bond Index seeks to measure the performance of treasury bonds issued by non-U.S. developed market countries with maturities of at least one year. | iShares 1-3 Year International TrsBd ETF (ISHG) | 05/31/2001 | 05/31/2026 |
| Marrkit iBoxx USD Liquid Investment Grade Index | iShares iBoxx $ Invmt Grade Corp Bd ETF (LQD) | 06/30/1963 | 05/31/2001 | ||
| ICE U.S. Treasury 20+ Year Bond IndexThe ICE U.S. Treasury 20+ Year Bond Index is part of a series of indices intended to the assess U.S. Treasury market. The Index is market value weighted and is designed to measure the performance of U.S. dollar-denominated, fixed rate securities with minimum term to maturity greater than twenty years. The ICE U.S. Treasury Bond Index SeriesTM has an inception date of December 31, 2015. Index history is available back to December 31, 2004. | iShares 20+ Year Treasury Bond ETF (TLT) | 06/30/1963 | 06/30/1963 | ||
| Intl Short Term Treasury Bond Alt | 0.350% | Bloomberg Barclays 1-3 Year Global Treasury ex-USThe Barclays Global Treasury ex US Index is a subset of the flagship Global Treasury Index that does not have any exposure to US debt. This multi-currency benchmark includes investment grade, fixed-rate bonds issued by governments in their native currencies. | State Street SPDR BlmbgSTIntrnTrsBdETF (BWZ) | 10/31/2007 | 05/31/2026 |
| Marrkit iBoxx USD Liquid Investment Grade Index | iShares iBoxx $ Invmt Grade Corp Bd ETF (LQD) | 06/30/1963 | 10/31/2007 | ||
| ICE U.S. Treasury 20+ Year Bond IndexThe ICE U.S. Treasury 20+ Year Bond Index is part of a series of indices intended to the assess U.S. Treasury market. The Index is market value weighted and is designed to measure the performance of U.S. dollar-denominated, fixed rate securities with minimum term to maturity greater than twenty years. The ICE U.S. Treasury Bond Index SeriesTM has an inception date of December 31, 2015. Index history is available back to December 31, 2004. | iShares 20+ Year Treasury Bond ETF (TLT) | 06/30/1963 | 06/30/1963 | ||
| Intl TIPS | 0.500% | Citi International Inflation-Linked SecuritiesThe index seeks to provide investment results that, before fees and expenses, correspond generally to the price and yield performance of an index that tracks the inflation protected sector of the global bond market outside the United States. | StateStreetSPDRFTSEIntGovInfProtdBdETF (WIP) | 03/31/2008 | 05/31/2026 |
| Marrkit iBoxx USD Liquid Investment Grade Index | iShares iBoxx $ Invmt Grade Corp Bd ETF (LQD) | 06/30/1963 | 03/31/2008 | ||
| ICE U.S. Treasury 20+ Year Bond IndexThe ICE U.S. Treasury 20+ Year Bond Index is part of a series of indices intended to the assess U.S. Treasury market. The Index is market value weighted and is designed to measure the performance of U.S. dollar-denominated, fixed rate securities with minimum term to maturity greater than twenty years. The ICE U.S. Treasury Bond Index SeriesTM has an inception date of December 31, 2015. Index history is available back to December 31, 2004. | iShares 20+ Year Treasury Bond ETF (TLT) | 06/30/1963 | 06/30/1963 | ||
| High-Yield Municipal Bonds | 0.350% | SPDR Nuveen Bloomberg Barclays High Yield Muni BonThe fund invests substantially all, but at least 80%, of its total assets in the securities comprising the index and in securities that the Sub-Adviser determines have economic characteristics that are substantially identical to the economic characteristics of the securities that comprise the index. The index measures the performance of U.S. dollar-denominated high-yield municipal bonds issued by U.S. states, the District of Columbia, U.S. territories and local governments or agencies. | Stt Strt SPDR Nuveen ICE HY Muncpl ETF (HYMB) | 04/30/2011 | 05/31/2026 |
| ICE U.S. Treasurey Short Bond IndexThe ICE U.S. Treasury Short Bond Index is part of a series of indices intended to assess U.S. Treasury market. The Index is market value weighted, and is designed to include U.S. dollar denominated, fixed rate securities with minimum term to maturity greater than one month and less than or equal to one year. The ICE U.S. Treasury Bond Index SeriesTM has an inception date of December 31, 2015. Index history is available back to December 31, 2005. | iShares 01 Year Treasury Bond ETF (SHV) | 06/30/1963 | 04/30/2011 | ||
| Stable Value Estimate | 0.000% | 1.5% Annual ReturnThis is not an index. It is a simulated 1.5% return annually used to represent a Stable Value fund or similar product. | n/a | 06/30/1963 | 04/30/2026 |
| 1-3 Year U.S. Treasury BondsTreasury bonds (T-bonds) are one of four types of debt issued by the U.S. Department of the Treasury to finance the U.S. government’s spending activities. The four types of debt are Treasury bills, Treasury notes, Treasury bonds, and Treasury Inflation-Protected Securities (TIPS). These securities vary by maturity and coupon payments. Maturity time is between 1 to 3 years. | iShares 1-3 Year Treasury Bond ETF (SHY) | 07/31/2002 | 06/30/1963 | ||
| ICE U.S. Treasury 7-10 Year Bond IndexThe ICE U.S. Treasury 7-10 Year Bond Index is part of a series of indices intended to assess the U.S. Treasury market. The Index is market value weighted and is designed to measure the performance of U.S. dollar-denominated, fixed rate securities with minimum term to maturity greater than seven years and less than or equal to ten years. The ICE U.S. Treasury Bond Index SeriesTM has an inception date of December 31, 2015. Index history is available back to December 31, 2004. | iShares 7-10 Year Treasury Bond ETF (IEF) | 06/30/1963 | 07/31/2002 | ||
| Convertible Securities | 0.400% | Bloomberg Barclays U.S. Convertible Bond > $500MMThe Barclays Capital U.S. Convertible Bond >$500MM Index represents the market of U.S. convertible bonds with outstanding issue sizes greater than $500 million. Convertible bonds are bonds that can be exchanged, at the option of the holder, for a specific number of shares of the issuer’s preferred stock or common stock.The Bloomberg Barclays US Convertible Bond > $500MM Index tracks the performance of USD-denominated convertible securities with minimum amount outstanding of $500mn. These bonds offer upside participation with an equity component (usually a non-detachable common stock warrant) and downside protection with a fixed income component (usually a bond or preferred stock) and can offer various degrees of equity exposure. The index is a subcomponent of the Bloomberg Barclays US Convertibles Index and was created in 2003. | State Street SPDR Blmbg Cnvrt Secs ETF (CWB) | 09/30/2009 | 04/30/2026 |
| Marrkit iBoxx USD Liquid High Yield IndexThe Markit iBoxx USD Liquid High Yield Capped Index consists of liquid USD high yield bonds, selected to provide a balanced representation of the broad USD high yield corporate bond universe. The index is used as a basis for tradable products, including ETFs. Multi-contributor pricing and support for the index from leading financial institutions ensure that the index is a tradable reflection of the corporate high yield bond market. | iShares iBoxx $ High Yield Corp Bd ETF (HYG) | 06/30/1983 | 09/30/2009 | ||
| Marrkit iBoxx USD Liquid Investment Grade Index | iShares iBoxx $ Invmt Grade Corp Bd ETF (LQD) | 06/30/1963 | 06/30/1983 | ||
| Target 2025 | 0.310% | Target 2025 IndexThe S&P Target Date 2025 Index is designed to represent a broadly derived consensus of asset class exposure and glide path for target date year 2025. The index allocates to equities and fixed income at varying levels, according to a pre-determined schedule related to the respective target date. | iShares Target Date 2025 (TZI) | 10/31/2003 | 04/30/2026 |
| S&P 500 IndexThe Standard and Poor's 500, or simply the S&P 500,[5] is a stock market index tracking the stock performance of 500 large companies listed on stock exchanges in the United States. It is one of the most commonly followed equity indices. As of December 31, 2020, more than $5.4 trillion was invested in assets tied to the performance of the index. | State Street SPDR S&P 500 ETF (SPY) | 06/30/1963 | 10/31/2003 | ||
| Moderate Allocation Fund | 0.150% | Blended IndexBlended index of stocks, bonds, and cash. A blended index combines two or more standard comparative indices. Blended indices are useful in evaluating the performance of accounts comprising different investment types. For such accounts, an individual index may not be a good indicator of how the account has performed. A blended index can more closely mirror the mix of investments in the account. | iShares Core 40/60 Moderate Allc ETF (AOM) | 06/30/1963 | 05/31/2026 |
| S&P 500 IndexThe Standard and Poor's 500, or simply the S&P 500,[5] is a stock market index tracking the stock performance of 500 large companies listed on stock exchanges in the United States. It is one of the most commonly followed equity indices. As of December 31, 2020, more than $5.4 trillion was invested in assets tied to the performance of the index. | State Street SPDR S&P 500 ETF (SPY) | 06/30/1963 | 06/30/1963 | ||
| Short-term U.S. Government Treasuries | 0.150% | ICE U.S. Treasurey Short Bond IndexThe ICE U.S. Treasury Short Bond Index is part of a series of indices intended to assess U.S. Treasury market. The Index is market value weighted, and is designed to include U.S. dollar denominated, fixed rate securities with minimum term to maturity greater than one month and less than or equal to one year. The ICE U.S. Treasury Bond Index SeriesTM has an inception date of December 31, 2015. Index history is available back to December 31, 2005. | iShares 01 Year Treasury Bond ETF (SHV) | 06/30/1963 | 05/31/2026 |
| ICE U.S. Treasury 7-10 Year Bond IndexThe ICE U.S. Treasury 7-10 Year Bond Index is part of a series of indices intended to assess the U.S. Treasury market. The Index is market value weighted and is designed to measure the performance of U.S. dollar-denominated, fixed rate securities with minimum term to maturity greater than seven years and less than or equal to ten years. The ICE U.S. Treasury Bond Index SeriesTM has an inception date of December 31, 2015. Index history is available back to December 31, 2004. | iShares 7-10 Year Treasury Bond ETF (IEF) | 06/30/1963 | 06/30/1963 | ||
| AQR Long-Short Equity I | 5.780% | AQR Long-Short Equity I | AQR Long-Short Equity I (QLEIX) | 07/31/2013 | 04/30/2026 |
| S&P 500 IndexThe Standard and Poor's 500, or simply the S&P 500,[5] is a stock market index tracking the stock performance of 500 large companies listed on stock exchanges in the United States. It is one of the most commonly followed equity indices. As of December 31, 2020, more than $5.4 trillion was invested in assets tied to the performance of the index. | State Street SPDR S&P 500 ETF (SPY) | 06/30/1963 | 07/31/2013 | ||
| Meridian Hedged Equity Le | 1.270% | Meridian Hedged Equity Legacy | Meridian Hedged Equity Legacy (MEIFX) | 01/31/2005 | 04/30/2026 |
| S&P 500 IndexThe Standard and Poor's 500, or simply the S&P 500,[5] is a stock market index tracking the stock performance of 500 large companies listed on stock exchanges in the United States. It is one of the most commonly followed equity indices. As of December 31, 2020, more than $5.4 trillion was invested in assets tied to the performance of the index. | State Street SPDR S&P 500 ETF (SPY) | 06/30/1963 | 01/31/2005 | ||
| Convergence Long/Short Eq | 1.520% | Convergence Long/Short Equity ETF | Convergence Long/Short Equity ETF (CLSE) | 12/31/2009 | 05/31/2026 |
| S&P 500 IndexThe Standard and Poor's 500, or simply the S&P 500,[5] is a stock market index tracking the stock performance of 500 large companies listed on stock exchanges in the United States. It is one of the most commonly followed equity indices. As of December 31, 2020, more than $5.4 trillion was invested in assets tied to the performance of the index. | State Street SPDR S&P 500 ETF (SPY) | 06/30/1963 | 12/31/2009 | ||
| JPMorgan Hedged Equity R6 | 0.320% | JPMorgan Hedged Equity R6 | JPMorgan Hedged Equity R6 (JHQRX) | 12/31/2013 | 04/30/2026 |
| S&P 500 IndexThe Standard and Poor's 500, or simply the S&P 500,[5] is a stock market index tracking the stock performance of 500 large companies listed on stock exchanges in the United States. It is one of the most commonly followed equity indices. As of December 31, 2020, more than $5.4 trillion was invested in assets tied to the performance of the index. | State Street SPDR S&P 500 ETF (SPY) | 06/30/1963 | 12/31/2013 | ||
| First Trust Long/Short Eq | 1.380% | First Trust Long/Short Equity ETF | First Trust Long/Short Equity ETF (FTLS) | 09/30/2014 | 05/31/2026 |
| S&P 500 IndexThe Standard and Poor's 500, or simply the S&P 500,[5] is a stock market index tracking the stock performance of 500 large companies listed on stock exchanges in the United States. It is one of the most commonly followed equity indices. As of December 31, 2020, more than $5.4 trillion was invested in assets tied to the performance of the index. | State Street SPDR S&P 500 ETF (SPY) | 06/30/1963 | 09/30/2014 | ||
| AB Select US Long/Short I | 1.610% | AB Select US Long/Short I | AB Select US Long/Short I (ASILX) | 12/31/2012 | 04/30/2026 |
| S&P 500 IndexThe Standard and Poor's 500, or simply the S&P 500,[5] is a stock market index tracking the stock performance of 500 large companies listed on stock exchanges in the United States. It is one of the most commonly followed equity indices. As of December 31, 2020, more than $5.4 trillion was invested in assets tied to the performance of the index. | State Street SPDR S&P 500 ETF (SPY) | 06/30/1963 | 12/31/2012 | ||
| Counterpoint Tactical Equity I | 1.620% | Counterpoint Tactical Equity I | Counterpoint Tactical Equity I (CPIEX) | 12/31/2015 | 04/30/2026 |
| S&P 500 IndexThe Standard and Poor's 500, or simply the S&P 500,[5] is a stock market index tracking the stock performance of 500 large companies listed on stock exchanges in the United States. It is one of the most commonly followed equity indices. As of December 31, 2020, more than $5.4 trillion was invested in assets tied to the performance of the index. | State Street SPDR S&P 500 ETF (SPY) | 06/30/1963 | 12/31/2015 | ||
| Catalyst/Millburn Hedge Strategy A | 2.250% | Catalyst/Millburn Hedge Strategy A | Catalyst/Millburn Hedge Strategy A (MBXAX) | 01/31/2016 | 04/30/2026 |
| S&P 500 IndexThe Standard and Poor's 500, or simply the S&P 500,[5] is a stock market index tracking the stock performance of 500 large companies listed on stock exchanges in the United States. It is one of the most commonly followed equity indices. As of December 31, 2020, more than $5.4 trillion was invested in assets tied to the performance of the index. | State Street SPDR S&P 500 ETF (SPY) | 06/30/1963 | 01/31/2016 | ||
| JHancock Disciplined Value Blb L/S I | 1.660% | JHancock Disciplined Value Glb L/S I | JHancock Disciplined Value Glb L/S I (JAKUX) | 01/31/2014 | 04/30/2026 |
| S&P 500 IndexThe Standard and Poor's 500, or simply the S&P 500,[5] is a stock market index tracking the stock performance of 500 large companies listed on stock exchanges in the United States. It is one of the most commonly followed equity indices. As of December 31, 2020, more than $5.4 trillion was invested in assets tied to the performance of the index. | State Street SPDR S&P 500 ETF (SPY) | 06/30/1963 | 01/31/2014 | ||
| Gotham Absolute Return Inst | 1.520% | Gotham Absolute Return Institutional | Gotham Absolute Return Institutional (GARIX) | 09/30/2012 | 04/30/2026 |
| S&P 500 IndexThe Standard and Poor's 500, or simply the S&P 500,[5] is a stock market index tracking the stock performance of 500 large companies listed on stock exchanges in the United States. It is one of the most commonly followed equity indices. As of December 31, 2020, more than $5.4 trillion was invested in assets tied to the performance of the index. | State Street SPDR S&P 500 ETF (SPY) | 06/30/1963 | 09/30/2012 |
Strategy Portal
Our Strategy Portal and its content is intended as a research tool. Individual client performance, holdings, etc. could differ from the information displayed in this portal.
All daily, month-to-date, year-to-date, and since inceptions returns are estimates.
A disclosure crawl appears at the top of the page indicating periods that are actual returns and those that are simulated. If the period selected for display and/or analysis includes both simulated and actual performance, these will be combined as one.
An enhancement to the strategy, designed to improve returns during the early months following a sharp market decline and following rally, was implemented in March 2021. Therefore, performance data is accessible for the strategy both with and without the enhancement.
The strategy is offered with varying fee structures. Therefore, performance data is accessible for the strategy net of the various fee structures. Furthermore, the strategy's gross return (no deduction for management fees or performance fees) is also accessible.
Portfolio Analysis Portal: Our Portfolio Analysis Portal and its content is intended to be a research tool. All performance is simulated (it is NOT actual performance of any clients). The performance is based on the selected portfolio and allocation of that portfolio. For more details on the simulated portfolios selected, see the "Compare Allocations" report from the Dashboard.
Patton Flex Strategy - the following is a description of the various performance data available:
Any combination of "Performance History Type" and "Fee Type" can be selected to access the described performance data.
The Flex Strategy was launched in February 2010. There is backtested research from July 1963. All returns prior to February 2010 are backtested. Furthermore, an enhancement was made to the Strategy implemented March 2021. The Research Returns allow you to see how the Strategy would have performed had this enhancement been in place since the Strategy inception.
Audacity Strategy - the following is a description of the various performance data available:
Any combination of "Performance History Type" and "Fee Type" can be selected to access the described performance data.
The Audacity Strategy was launched in April 2020. There is backtested research from July 1963. All returns prior to April 2020 are backtested. Furthermore, an enhancement was made to the Strategy implemented March 2021. The Research Returns allow you to see how the Strategy would have performed had this enhancement been in place since the Strategy inception.
Source Data for Analysis
Any analysis reflecting daily performance for any Patton Investment Strategy is actual data for the periods available and back-tested data for prior periods. Daily data for diversified portfolios uses an applicable index fund (see the Asset Classes table in this Disclosure "Index Fund" column) performance less the applicable fees.
Mutual fund performance and performance statistics come from Steele Mutual Fund Expert (https://steelesystems.com/).
Click here to access the Legal Notice.
Disclosure: full